NinjaTrader, our Featured Platform
Kinetick, our Preferred Data Provider for NinjaTrader 7
(Scroll down to the bottom of this page to see what's available from Kinetick!)
PBF Indicator Package for NinjaTrader are AVAILABLE NOW for version 6.5 and 7.0!!!!
"I just received the indicators and all I can say is WOW!!! Fantastic. Thank you for the great service and for sharing all your hard work developing the indicators. I am proud to be the first NinjaTrader customer. I am interested in the other indicators also. With just the three indicators I have purchased I can see on my charts that they are money makers. Great Job. in the past when I purchased other indicators they might work on a symbol in a certain time frame then when I would change symbols or time frames they didn’t work and had to be adjusted yet I could never seem to get them right. Your indicator is spot on with every symbol or time frame I have thrown at it. Bravo!!!
Regards,
Michael B., WA"
Please scroll down to the bottom of this page for information on how to obtain your Machine ID, how to import indicators to your platforms,
how to set up your chart, and where to save the Template if you get the indicator package.
NinjaTrader is the preferred active trader platform for traders worldwide including our clients. We are pleased to offer NinjaTrader to our clients for many reasons but one great reason is that you can get started with NinjaTrader for Free! Why pay hundreds of dollars per month for products with less functionality when with NinjaTrader all you need is access to a real-time or historical data feed. You can also connect NinjaTrader to Kinetick, our preferred market data service, for free End-of-Day data!
NinjaTrader
provides superior order entry options!
If
you are using the wrong trading platform, order submission and trade management
can be a timely and error prone process. Since 2003, NinjaTrader has pioneered easy to
use yet powerful order entry and trade management functionality to overcome the
limitations of other trading platforms helping our clients better achieve their
trading goals!
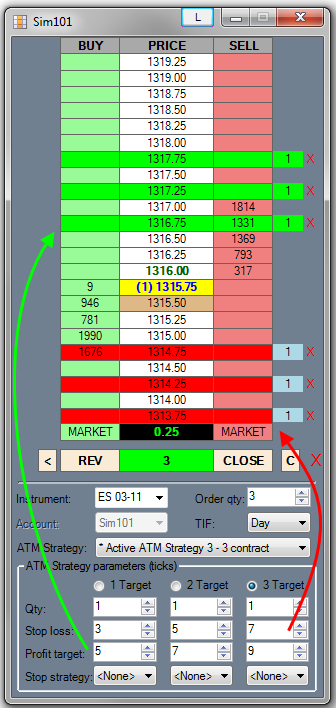
The innovative NinjaTrader SuperDOM and Chart Trader set
the benchmark for order entry screens and is one reason we recommend it to our
clients. Considered the industry’s best
order entry screens they provide traders with ease of operation, clear trade
visualization and fast entry to capitalize on today’s markets.
SuperDOM
- Easy to see trade visualization
- Single click order entry, modification and
cancellation
- Can be use with Advanced Trade Management (ATM)
module
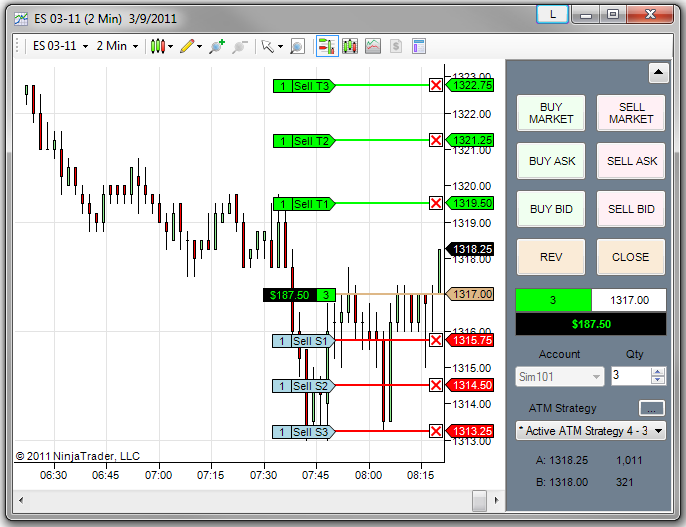
Chart Trader
- Easy to see trade visualization on the chart
- Single click order entry, modification and
cancellation from the chart
- Can be use with Advanced Trade Management (ATM)
module
NinjaTrader is the
industry leader in trade management features!
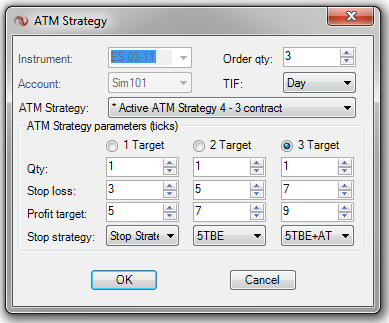
Advanced Trade Management (ATM) is NinjaTrader’s
signature order management technology that lets you pre-define personal trade
management strategies including; multiple profit targets and stop loss orders,
one-cancels-other (OCO) orders, auto-breakeven stops, trailing stops and much
more. This feature can significantly
enhance trade performance by automatically submitting all entry/exit orders
within milliseconds! This feature alone
tends to cover the cost of the platform while simultaneously lowering your stress
level by eliminating the “deer in the headlights” feeling commonly associated
with manually managing multiple exit orders in fast moving markets.
ATM entry box image
- Easily specify multi-stage exit parameters
- Single check box to create an auto-breakeven
stop
- Highly configurable and easy to use auto-trail
stop
 a
Utilize
NinjaTrader’s comprehensive market analytics tools to help find trading
opportunities!
Regardless of what markets you trade, what style of
trader you are or if you require real time or end of day analytics, the
NinjaTrader trading platform provides you the tools to analyze the markets and
your trading ideas in a flexible, customizable and user-friendly manner that
helps you trade better.
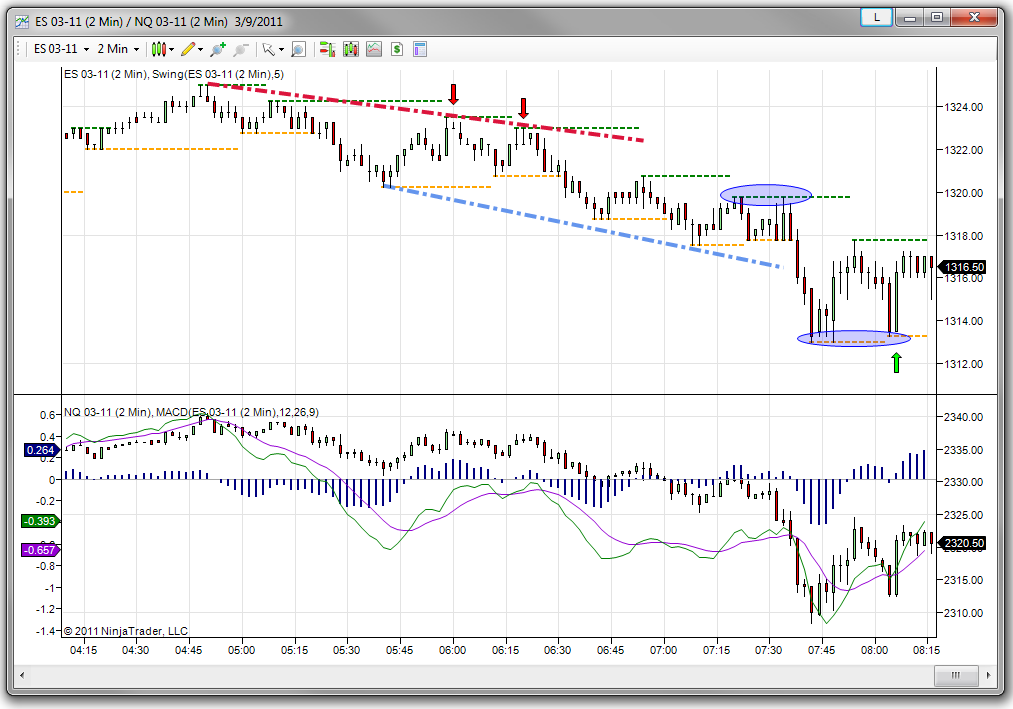
Charting
- Powerful market visualization
- Multi-time frame and multi-instrument analysis
- Over 100 pre-built customizable indicators plus
100s of optional 3rd party indictors
 a a
Other Analysis Tools
- Trade performance tool
- Market Analyzer
- Strategy analyzer
Automate and
customize your trading!
Take your trading to the next level through custom
development and trade automation! NinjaTrader
provides you with the ability to automate your trading strategies whether they
were developed natively using NinjaScript® or in an external application such
as TradeStation.
Automated and Custom Trading
- Develop or purchase automated trading strategies
- Analyze automated trading strategies
- Execute automated trading strategies
- Process Trading signals from external
applications
- Create or purchase 3rd party custom
charting indicators
Choice of Market Data Services and Broker Connectivity Options
NinjaTrader is a broker
independent trading platform so you have choice on where you can execute your
trades. NinjaTrader supports all leading independent market data service
providers including Kinetick, our preferred
market data service. Paper trade and do your analysis with real time data
without having to pay a single penny for software!
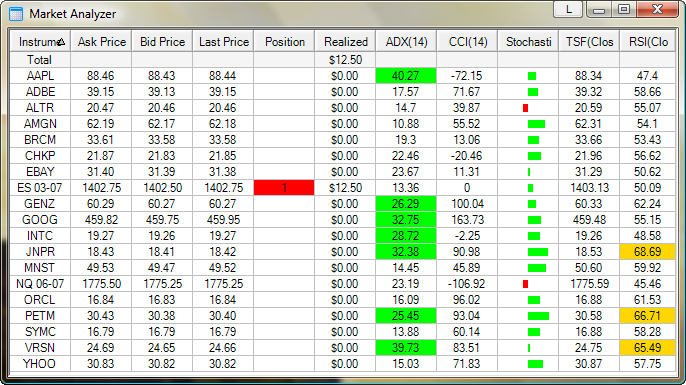
Market Analyzer
NinjaTrader’s Market AnalyzerTM window is a turbo-charged quote sheet with multi-instrument real-time scanning and analysis with access to over 100 pre-built indicators and data columns.
- Customizable Indicator Columns
- Real-time Rule-based Color Coding & Alerting
- Dynamic Ranking, Sorting and Filtering
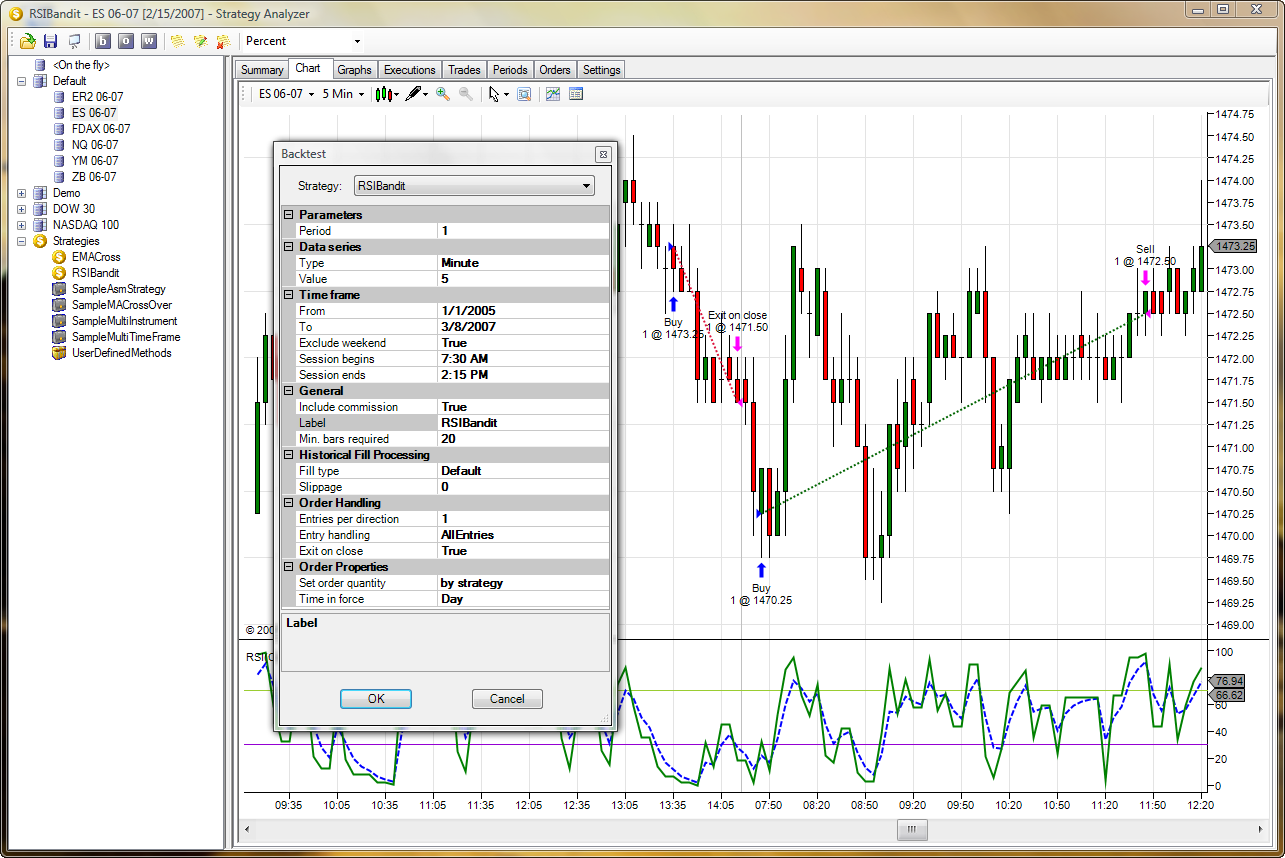
Strategy Development and Backtesting
Develop your strategy concept, construct it, historically test it, optimize it, live simulation test it and then live deploy it through your account at our brokerage. No where else can you find such a comprehensive end to end system development and automation platform.
- Strategy Creation for Non-Programmers
- Strategy Development using NinjaScript™
- High Performance Backtesting
- Real-Time Simulated Testing
- Real-Time Order Handling & Live Automation
NinjaTrader is
committed to providing Education and Support
Our team is technically familiar with NinjaTrader and
provides basic client assistance. The
NinjaTrader team however is deeply versed in all aspects of platform operation
and can be easily accessed through email or their support forum. Their dedicated team of twenty plus client
support specialist are at the ready should you ever need platform
assistance. In addition, NinjaTrader
provides daily educational webinars and a complete context sensitive online
user’s manual interlaced with many product videos to minimize your platform
learning curve.
Education and Support
- Free daily NinjaTrader training webinars
- Media rich help guide
- Video library
- Active user community
Download
NinjaTrader Now
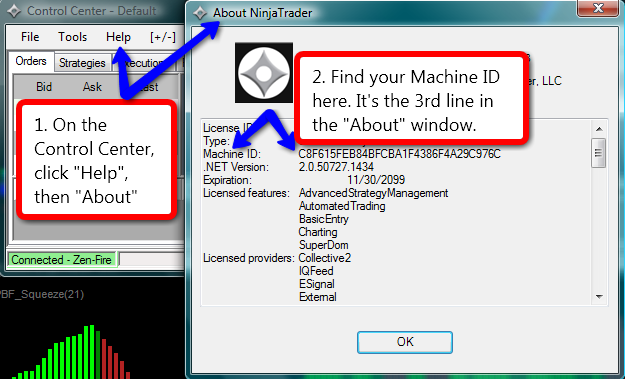
ATTENTION NinjaTrader Customers:
This is how you obtain your Machine ID on NinjaTrader Platform. Please make sure you send the correct number to us after placing your orders.
How to Import PBF Indicators to Your NinjaTrader Platform
To import the indicators, first save the attached PBF_XXXXXXX.Zip file(s) we send you on your desktop or anywhere else you can easily find. Open NinjaTrader platform, on your Control Center, click "File, Utilities, Import NinjaScript...." click Yes to the warning message, another window will pop up, locate the Zip file(s), highlight it and click "Open". The indicators will be imported automatically! Then you will be able to add them on your chart as you would any other indicators. Right click on a chart, click "Indicators..." All our indicators are named under "PBF_XXXXXXX".
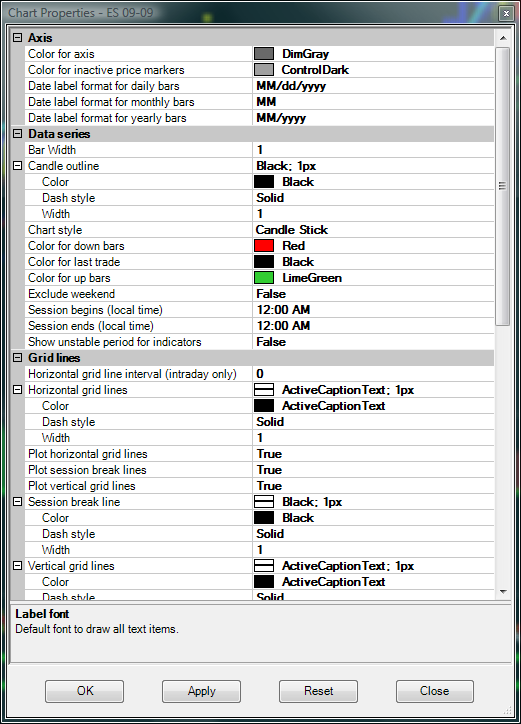
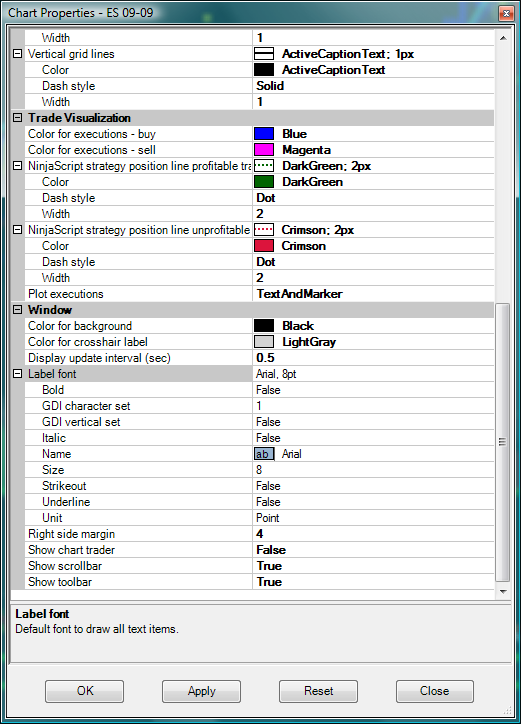
How to change the Background of your Chart so Your chart will look like ours
You don't have to do this, it is not required. However, some of our indicators use the color White. If you have a white background, you won't see these lines. Black background is our choice. If you want to change the background of your chart so it looks exactly like ours, simple copy our settings on the screen shots below by right click on the chart, then click "Property".
* If you purchase the PBF Indicator Package, we will send you a TEMPLATE as well. Save this Template here:
C:Users - Your Name - Documents - NinjaTrader 7 - templates - Chart
* If, for any reason, you need to DELETE an indicator, here is how you do it:
To delete an installed DLL, you need to go: Control Center > File > Utilities > Remove NinjaScript Assembly
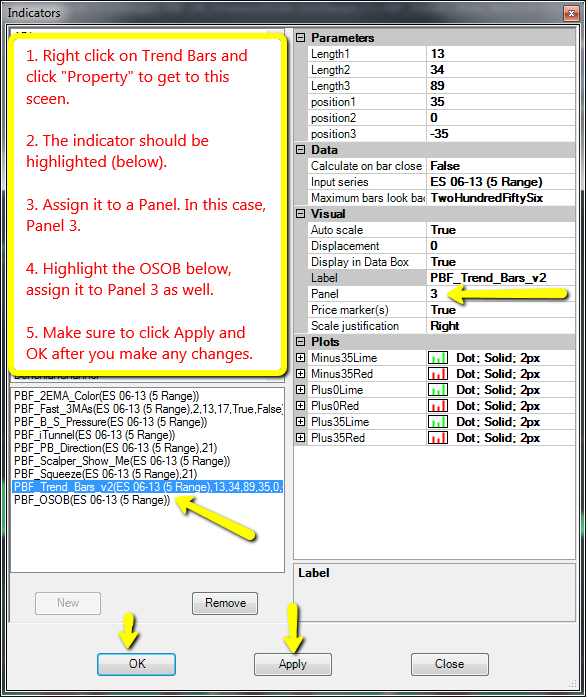
* How to Overlay Trend Bars and OSOB and put them in the same sub graph:
**************************************************************************
Please read the following paragraphs carefully before ordering:
As an end user of our indicators, there is probably no need for you to understand the differences between coding languages for various platforms. All that is required for you as a trader, is to be proficient in using the software in order to gain an edge in your trading. However, we at PaintBarFactory.com believe in full disclosure. It is our style to be honest in outlining all the facts clearly for you to see. Please take a minute to read through this section to ensure that you have understood and agree with all that is explained below prior to placing your order.
As traders, we have developed these indicators for our own personal use initially. We have been trading with these indicators for a couple of year, before accidentally starting this website. Over the past year, we were contacted by Dan at NinjaTrader who encouraged us to develop our tools for the NinjaTrader platform. We also received numerous requests on a weekly basis from traders all around the world even with no advertising on our part for NinjaTrader version. Our decision to look into the C# language and learning how to code for NinjaTrader occurred as a result of a visitor from Canada who responded to our indicators in a manner that truly touched us with his beautiful words. This has stuck in our minds and motivated us to put forth this set of indicators for use in the NinjaTrader platform.
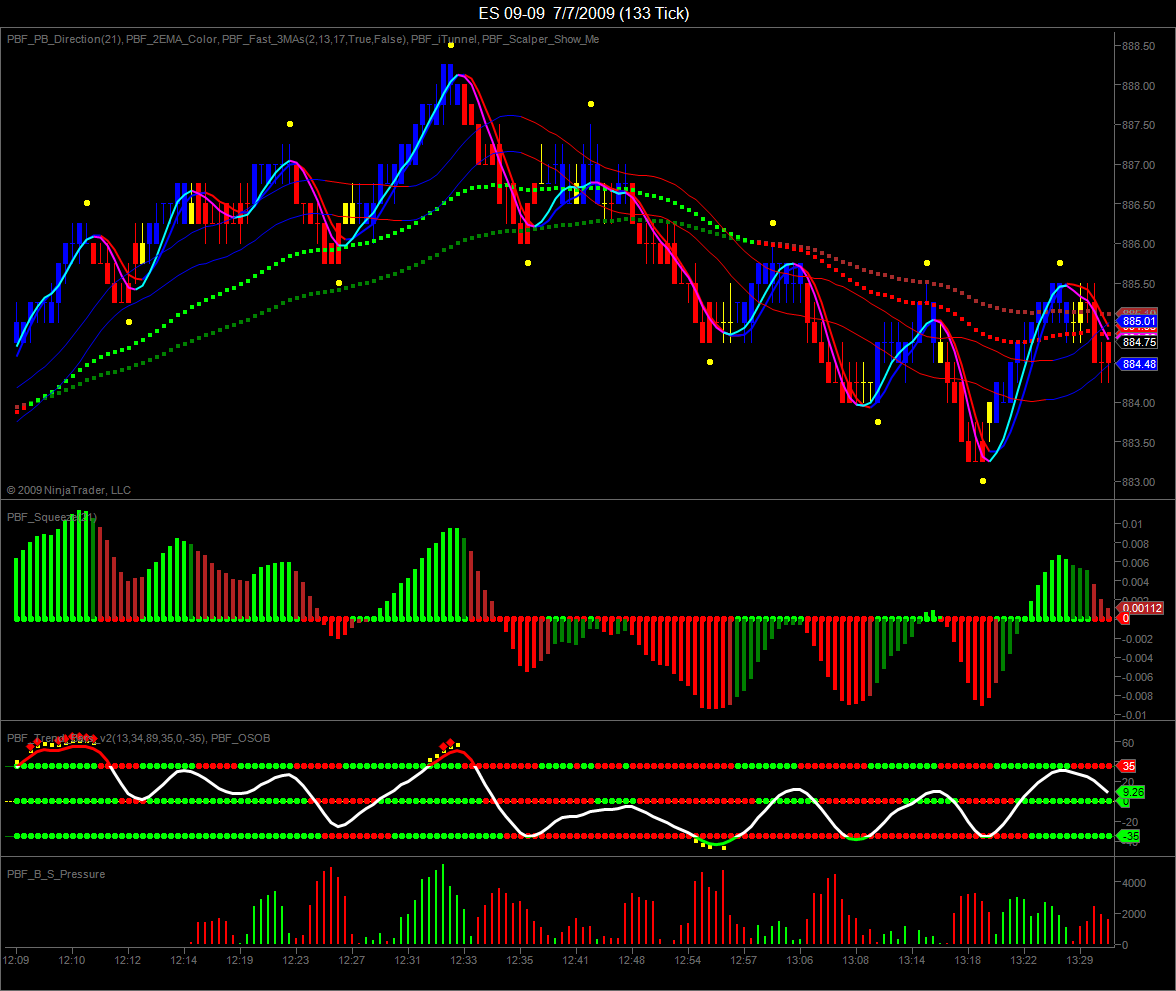
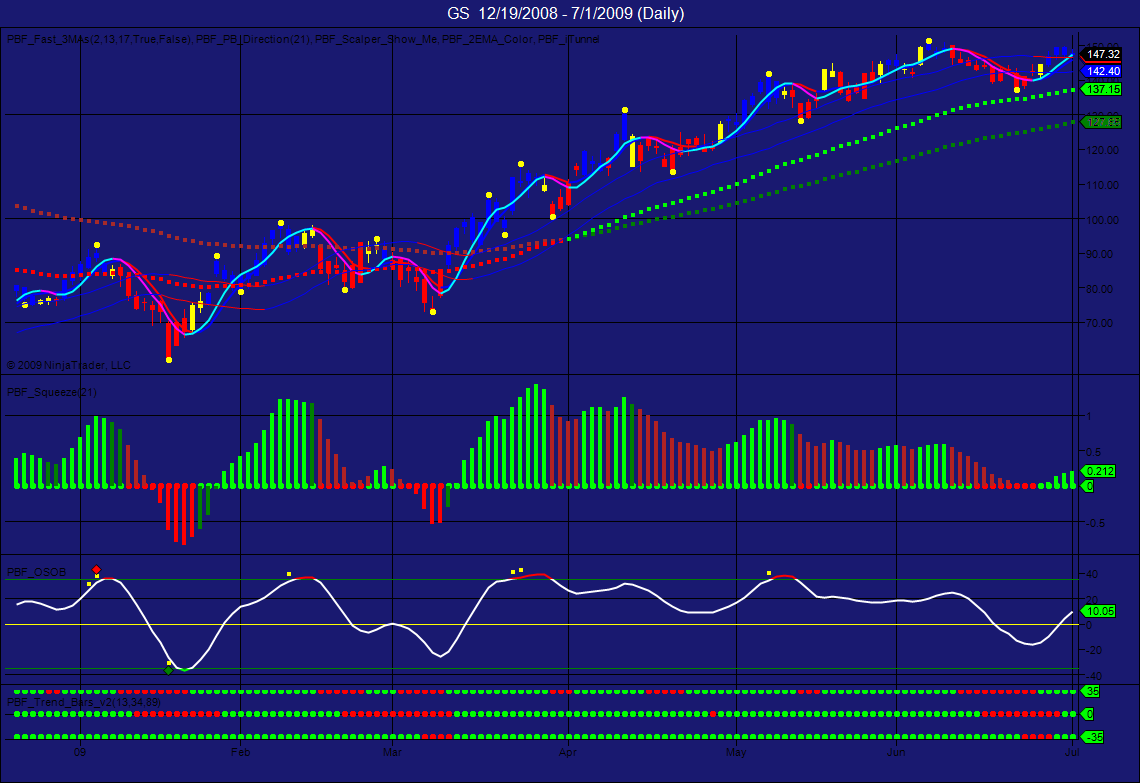
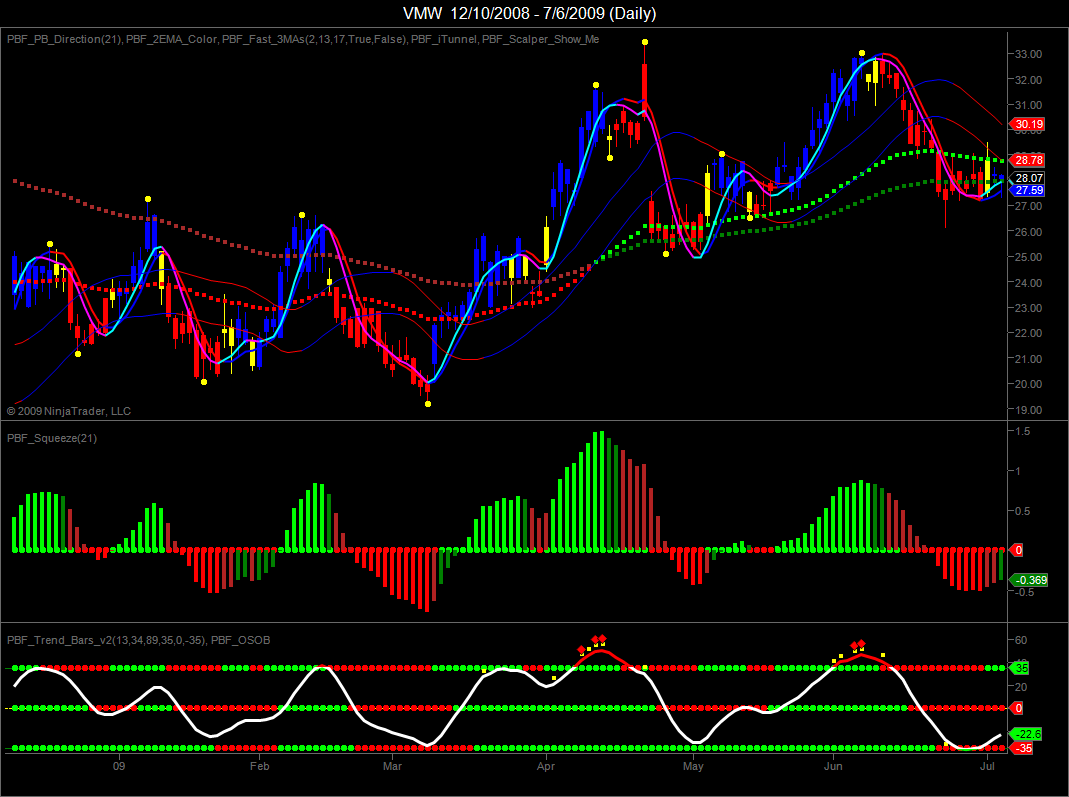
Now let's get to the point. We will use the chart below as an example to illustrate what we want to discuss here.
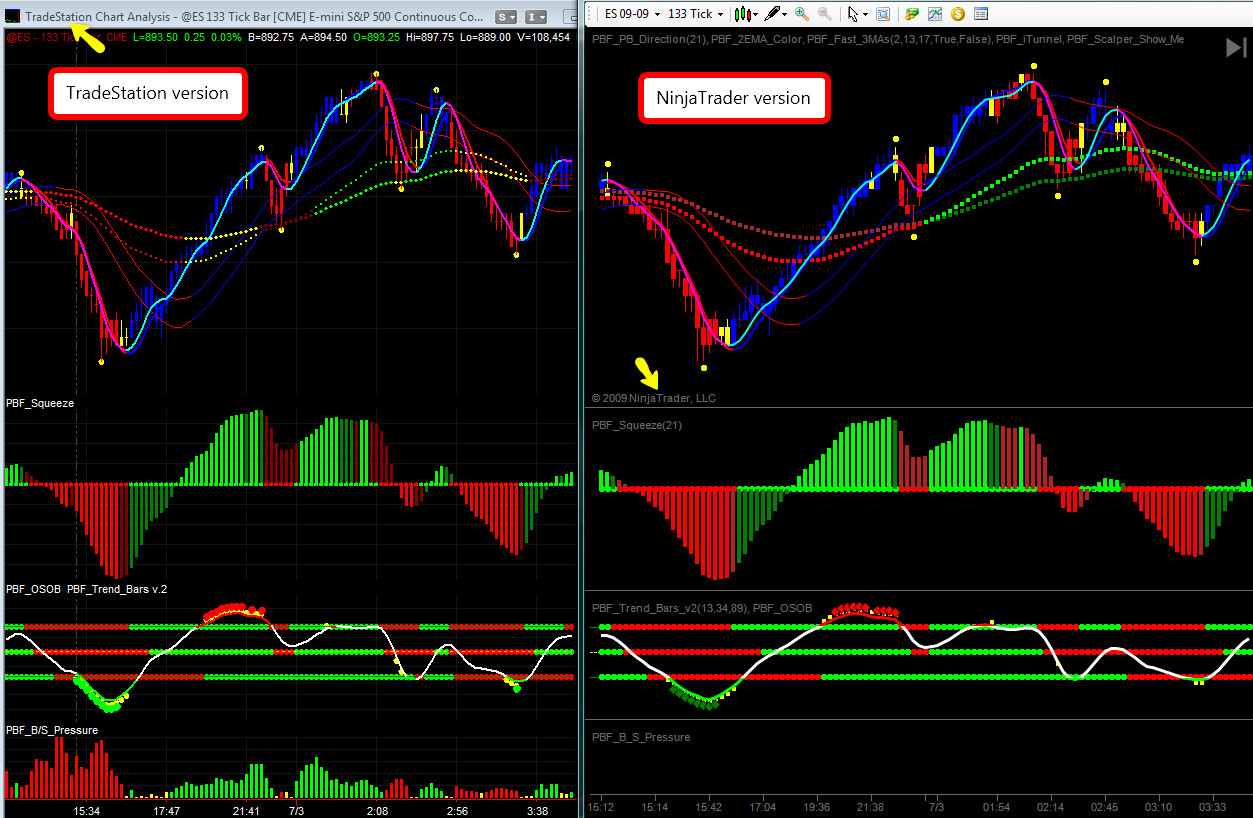
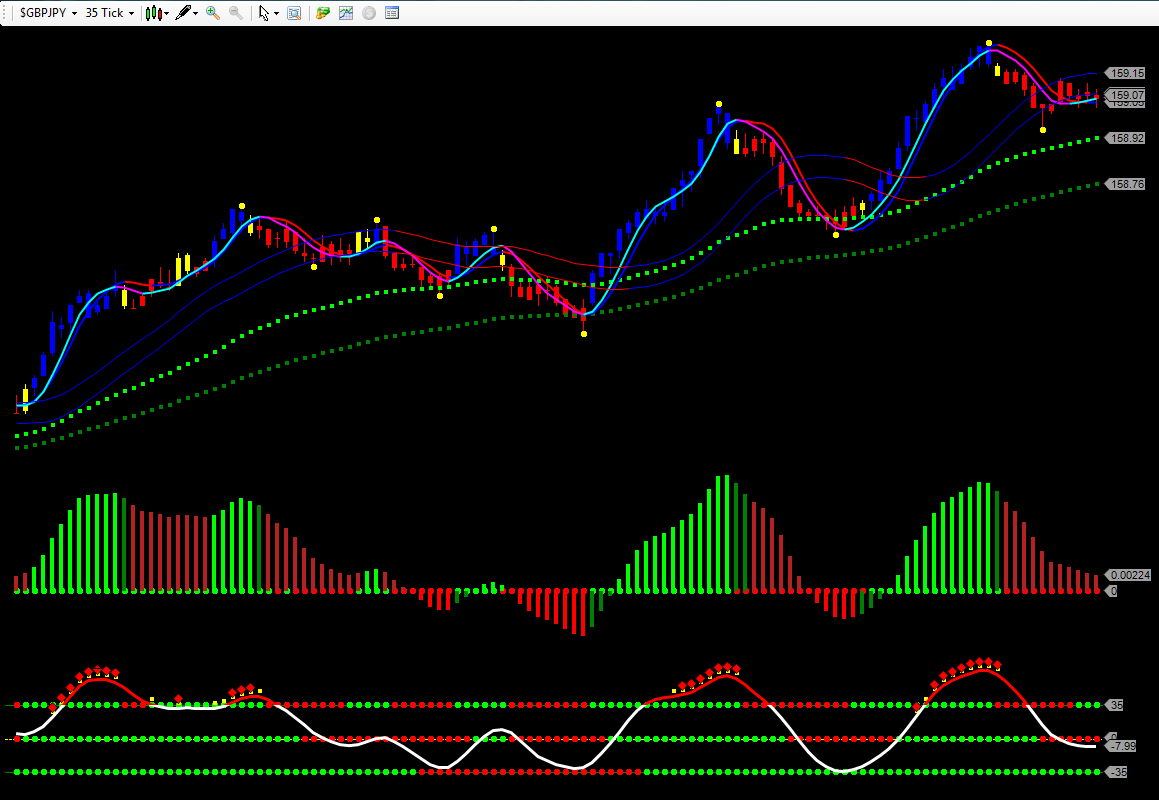
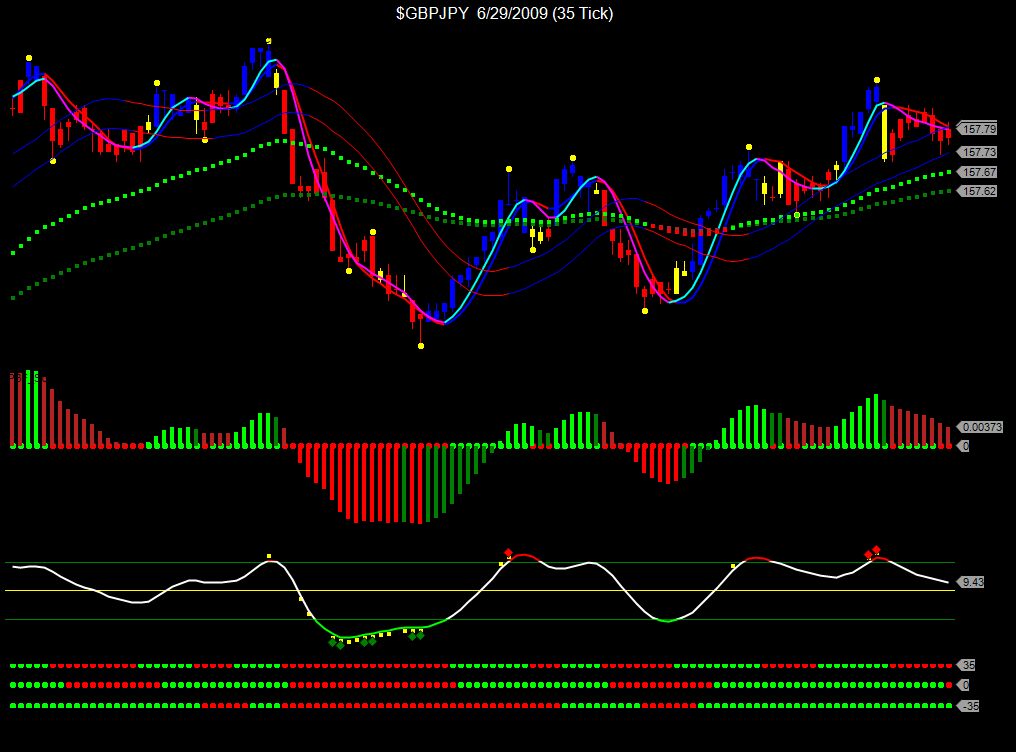
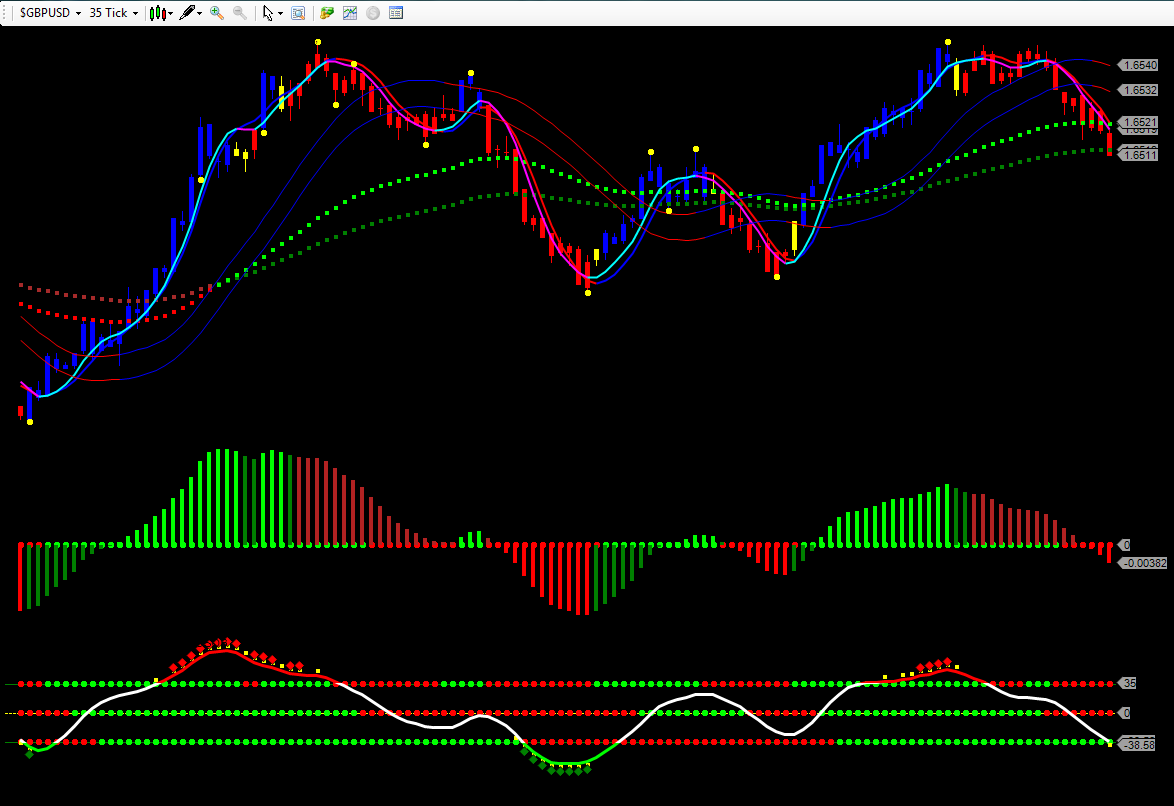
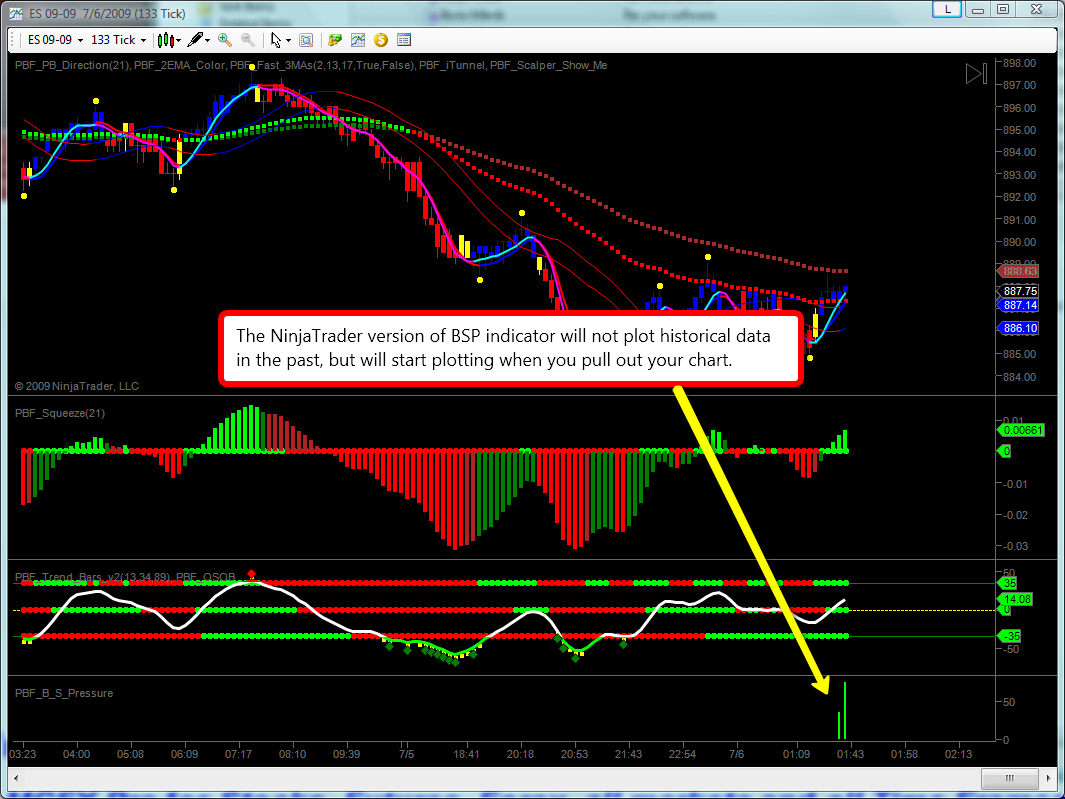
Since NinjaTrader is our latest development, you will probably find more charting examples saved using TradeStation platform on the website. We use TradeStation's data feed for MultiCharts, so chances are charts saved using these two platforms will look exactly the same, especially because they also use the same coding language to code indicators. On the chart above, first you will notice the data (candlesticks) is not quite the same. It is understandable since those are tick charts. The starting tick does play a role on how a chart looks like.This will make the charts look slightly different but no big deal. Next you might notice the Buy Sell Pressure indicator on NinjaTrader chart is blank. This is because NinjaTrader does not store historical uptick/downtick intra-bar data required for this indicator to function. But it will work on live market condition and start plotting from the moment you open your chart. Like TradeStation version, it only works on intraday charts, not daily chart or higher time frames. It also doesn't work on Forex markets for all platforms, as there is no volume data for forex market at all.
Also due to lack of the uptick/downtick data, we will not be able to offer the free PB_VTM Paint Bar study (not shown on this chart) for NinjaTrader customers which requires that kind of intraday volume data. This paint bar also uses gradient coloring method, the function for which is not available in C# language. (For the same reason, the "Show Trend" mode in PB_Direction paint bar study is also not available, but the import "Yellow Bar" calculation works just as well). Using EasyLanguage, we can draw a line as one plot, and then paint several different colors on it. But with C# language, each color must have its own plot. We simply can not (and will not) assign 20-30 different colors/shades to that many plots for each different value of calculation. Not that this can't be done, nor because it's a free paint bar we give away, but because the more plot it has, the more computing resources it might acquire. It simply makes no sense for us to code it, while most customers might not even use it, and it could be a potential problem for older or slower computers. And please don't ask for a discount, because we never give one! If later on we have a different idea for another paint bar study, we will make it up to you.
Also due to the nature of the C# language for coloring, we have decided to keep the EMAs simple with only Lime/Red and Green/Brown for NinjaTrader version, to avoid taking unnecessary resources from your CPU. The other indicators are pretty close if not exactly the same. As mentioned above, the slight difference in data source could play a role in this. Also sometimes a function used in C# language will only take an "integer" number instead of a fraction of 1 as EasyLanguage would take. But this will not affect the power and effectiveness of the indicators, because we do not care about the "absolute" value of a plot. Zero will always be zero. Positive and negative will stay positive and negative. We compare the values to see which direction the market is going. And many color criterions are done by comparing two or three numbers. Since they are all "relative" to one another, the "absolute" numbers really don't matter, as long as on one chart the value goes from, for example, 1.2 to 1.5, and on the other platform it goes from, say, 1.1 to 1.4. As long as they are moving in the same direction, which they absolutely are, that's all we care.
Once again, you don't really need to understand any of the coding nuances here. The reason for this section is to ensure that you are aware of these subtleties, so hopefully you won't be sending us emails asking, "How come my chart doesn't look 100% like yours on the website?" or "How come I have 4 red bars and you only have 3?" Your NinjaTrader charts should look exactly like my NinjaTrader charts if we have the same data feed starting from the same point in time without a bad tick using the same time frame.
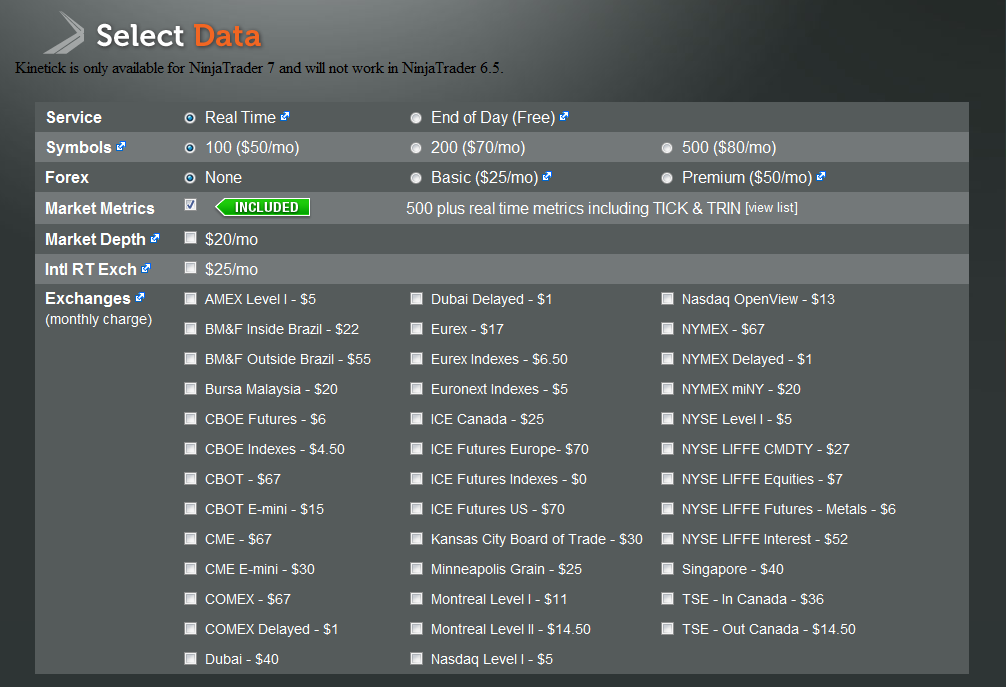
Here is a list of availabe data from our preferred data provider Kinetick:
Disclaimer: All TRADING involvesrisk, while there is a potential tomake a substantialamount of money,youCAN LOSE a substantial amount of money as well, no matter what method you use. All trading involvesrisk; past performance is not necessarily indicative of future results.
Commission Rule 4.41(b)(1)(I) hypothetical or simulated performance results have certain inherent limitations. Unlike an actual performance record, simulated results do not represent actual trading. Also, since the trades have not actually been executed, the results may have under- or over-compensated for the impact, if any, of certain market factors, such as lack of liquidity. Simulated trading programs in general are also subject to the fact that they are designed with the benefit of hindsight. No representation is being made that any account will or is likely to achieve profits or losses similar to those shown.
ONE OF THE LIMITATIONS OF HYPOTHETICAL PERFORMANCE RESULTS IS THAT THEY ARE GENERALLY PREPARED WITH THE BENEFIT OF HINDSIGHT. IN ADDITION, HYPOTHETICAL TRADING DOES NOT INVOLVE FINANCIAL RISK, AND NO HYPOTHETICAL TRADING RECORD CAN COMPLETELY ACCOUNT FOR THE IMPACT OF FINANCIAL RISK IN ACTUAL TRADING. FOR EXAMPLE, THE ABILITY TO WITHSTAND LOSSES OR TO ADHERE TO A PARTICULAR TRADING PROGRAM IN SPITE OF TRADING LOSSES ARE MATERIAL POINTS WHICH CAN ALSO ADVERSELY AFFECT ACTUAL TRADING RESULTS. THERE ARE NUMEROUS OTHER FACTORS RELATED TO MARKETS IN GENERAL OR TO THE IMPLEMENTATION OF ANY SPECIFIC TRADING PROGRAM WHICH CANNOT BE FULLY ACCOUNTED FOR IN THE PREPARATION OF HYPOTHETICAL PERFORMANCE RESULTS AND ALL OF WHICH CAN ADVERSELY AFFECT ACTUAL TRADING RESULTS.
THERE IS RISK OF LOSS IN ALL TRADING. PAST PERFORMANCE IS NOT INDICATIVE OF FUTURE RESULTS. ALL RESULTS ARE HYPOTHETICAL. NO IMPLICATION IF BEING MADE THAT ANYONE UTILIZING ANY OF THE INDICATORS OF PAINTBARFACTORY.COM HAS OR CAN OBTAIN SUCH PROFITS AND RESULTS. THE INFORMATION SUPPLIED ON THIS WEBSITE IS MERELY A PRESENTATION OF TRADING TOOLS AND STRATEGIES, FOR INSTRUCTIONAL AND EDUCATIONAL PURPOSES ONLY.
This is not a prospectus; no offer on our part with respect to the sale or purchase of any securities is intended or implied, and nothing contained herein is to be construed as a recommendation to take a position in any market.The material presented herein has been obtained or derived from sources believed to be accurate, but we do not guarantee its accuracy or completeness. There have been no promises, guarantees or warranties suggesting that any trading will result in a profit or will not result in a loss.The TRADERis responsible for his own actions.
|