Bonus Indicators
Indicators on this page are bonuses WITH purchase of another indicator only
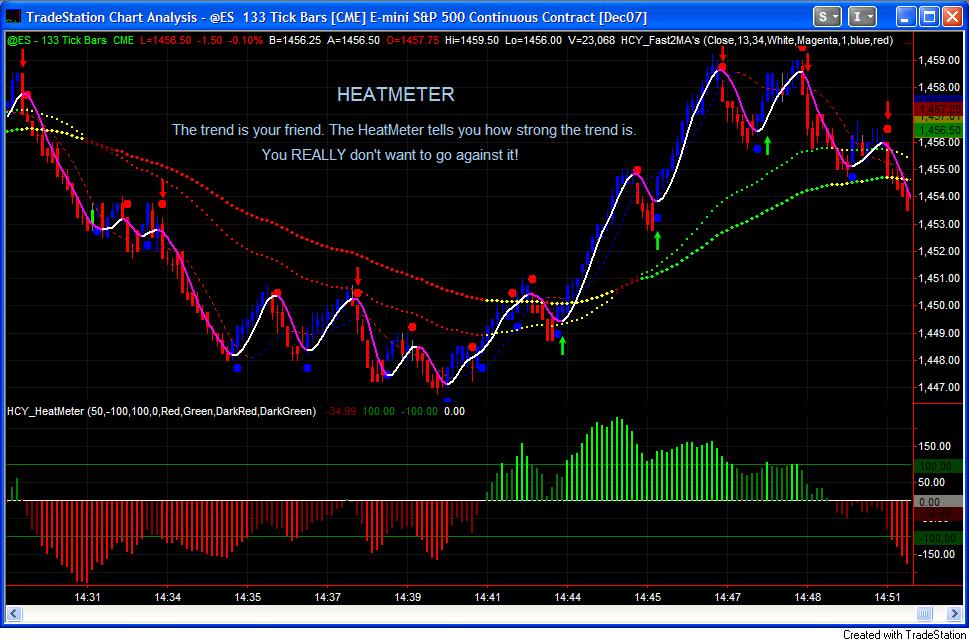
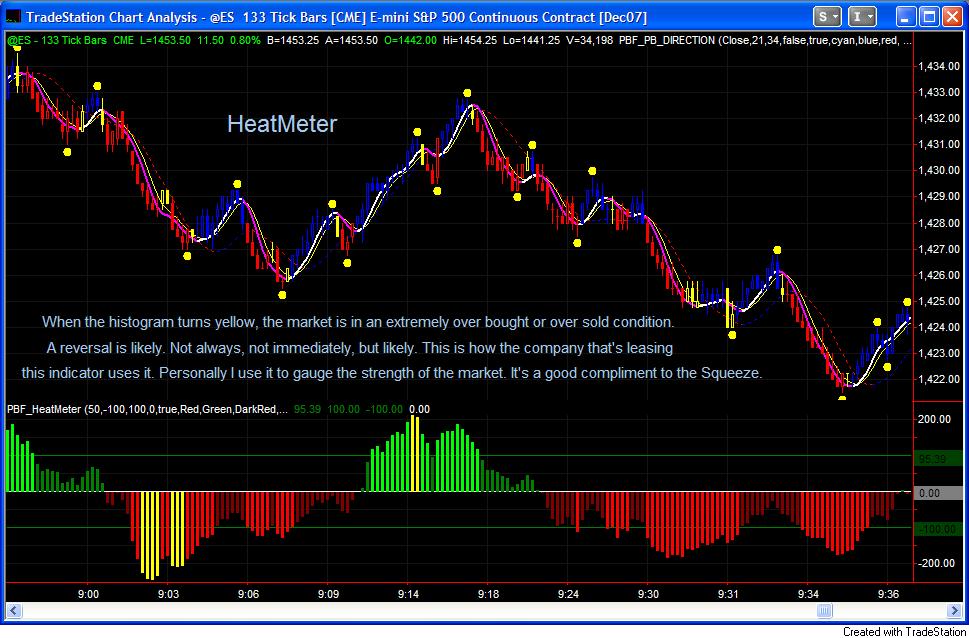
HeatMeter ($FREE with the purchase of the iTunnel, compare with $395/month one company is leasing)
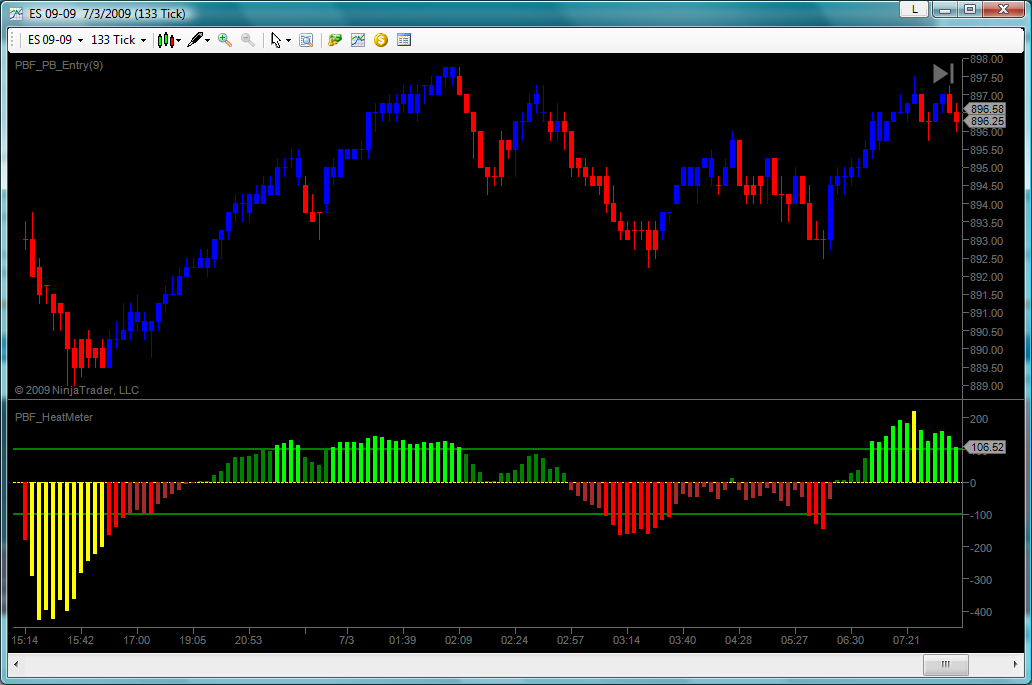
This indicator and the iTunnel are similar to part of the indicator package one company is leasing for $395 a month (as of the writing of this description). In fact, this indicator can be exactly the same if you just change the setting to a different number. It tells you the strength of the trend, gives you a directional bias. You really don't want to go long when it's red, or go short when it is green. Because my friend, the trend is your friend. Unless indicated by another indicator such as the Squeeze to tell you otherwise, you should always trade with the trend. It's safer and much more profitable. This is how I interpret it. The company that is leasing it uses it to gauge the possibility of a trend reversal. But honestly, I have a better and more precise way: The Squeeze!
Here is a screen shot of the NinjaTrader version of the HeatMeter.
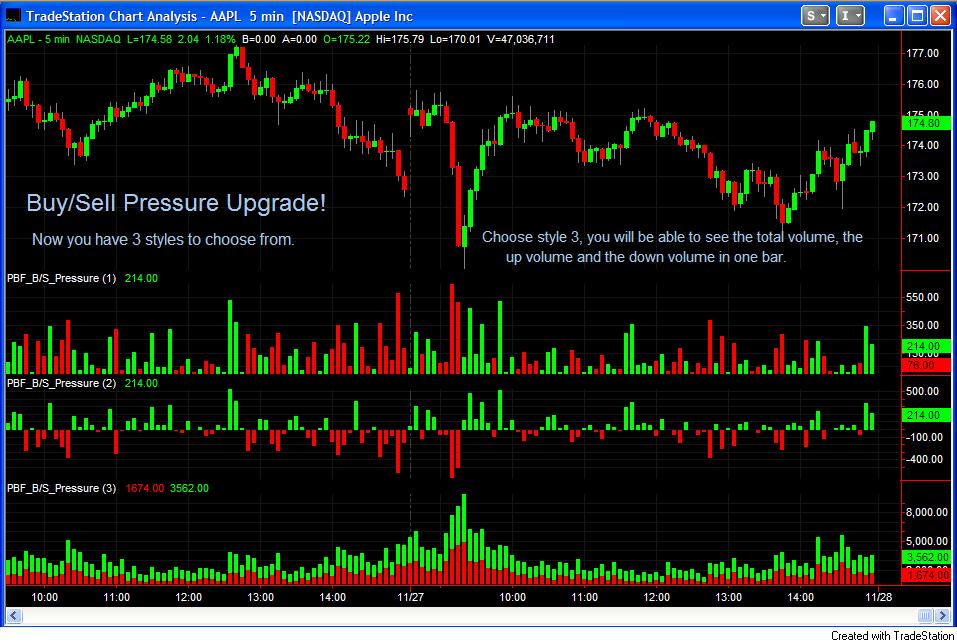
Buy/Sell Pressure ($FREE with the purchase of the Squeeze Indicator)
Here is one indicator that's included in a package one company is selling for hundreds, and they don't even have as many "styles" as I have. That really doesn't matter, as only one style is really useful, which they don't have.
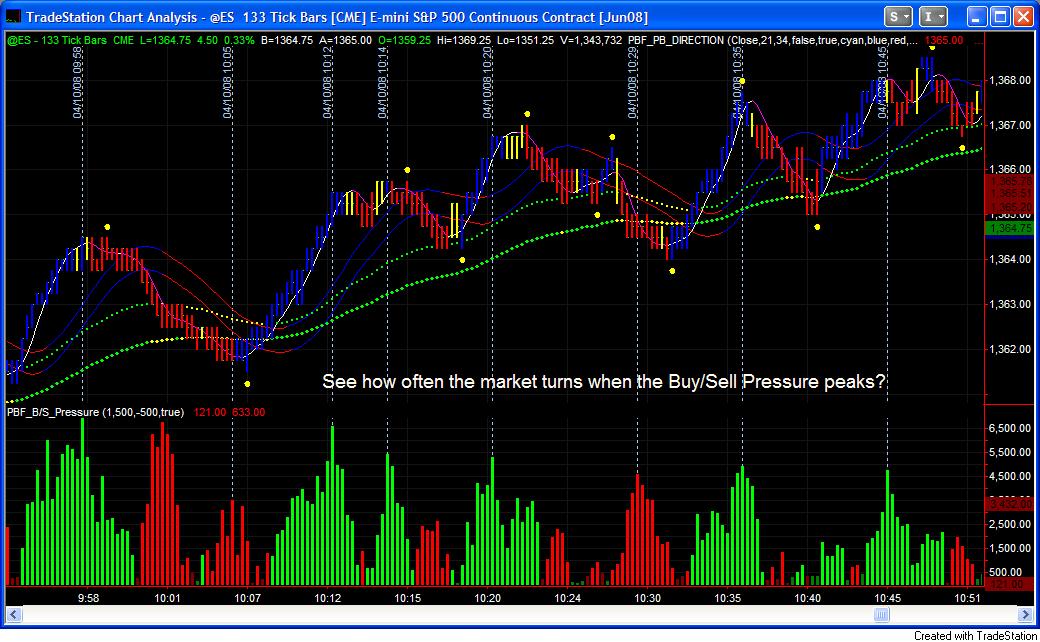
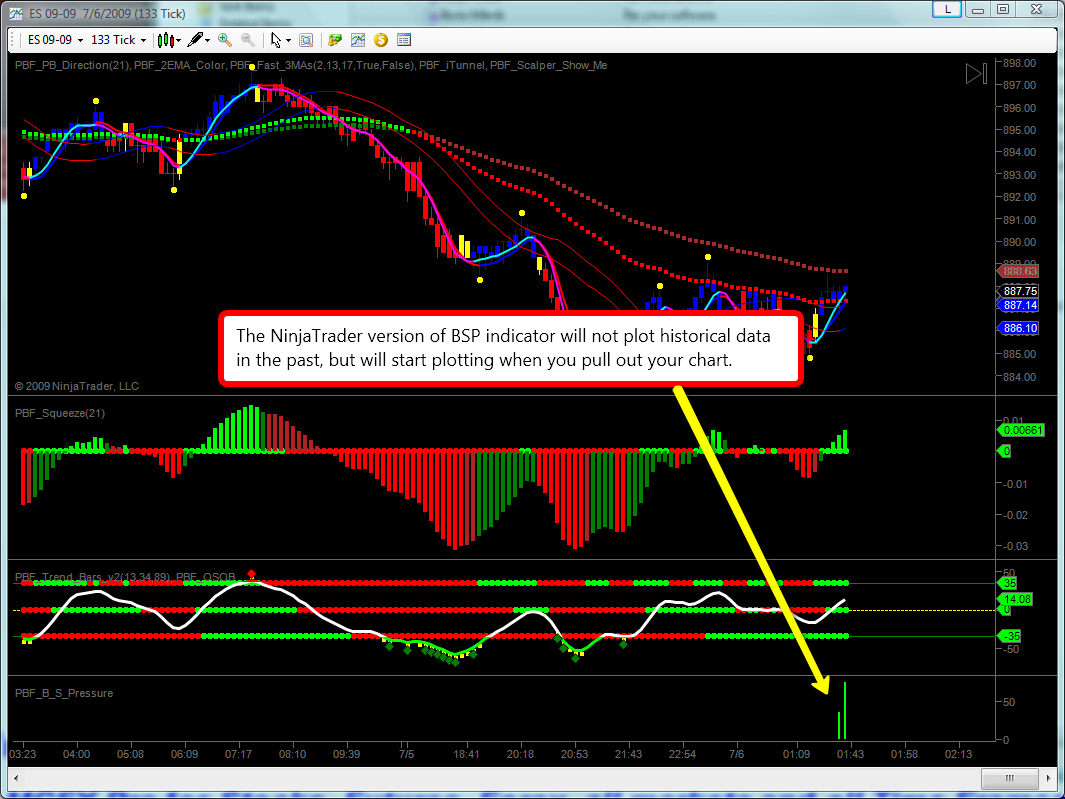
I am a big fan of Buy/Sell Pressure. The law of supply and Demand is what's moving the market. When there are more buying than selling, the price goes up. When the sellers outnumber the buyers, the market goes down. Simple as that.
Below is a chart illustrating how the Buy Sell Pressure indicator works on NinjaTrader platform. It will not ploat historical data in the past, but will start plotting from the first bar when you pull out the chart. Only ONE style of the Buy Sell Pressure is available for NinjaTrader version for the same reason.
For TradeStation and MultiCharts version, we coded it in a way that you can choose between several different styles. See charts below. Only works on intraday charts. For daily, weekly and monthly charts, you only get the total volume of the day/week/month.
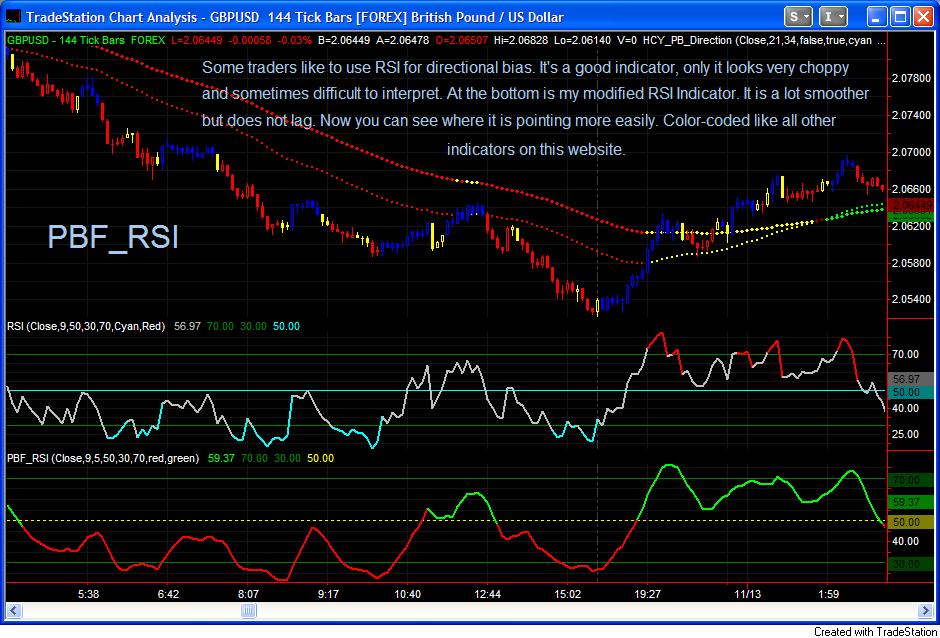
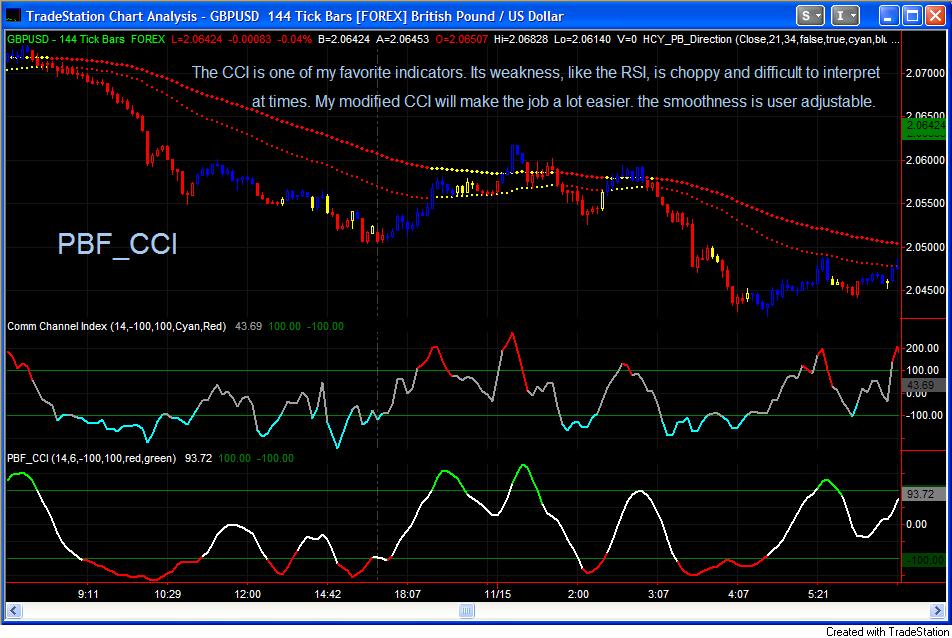
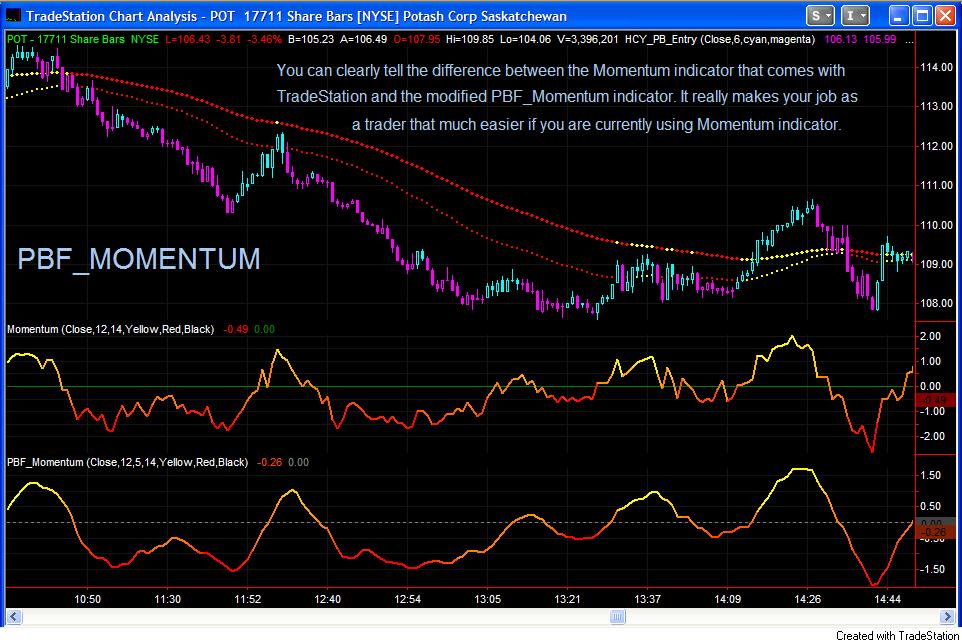
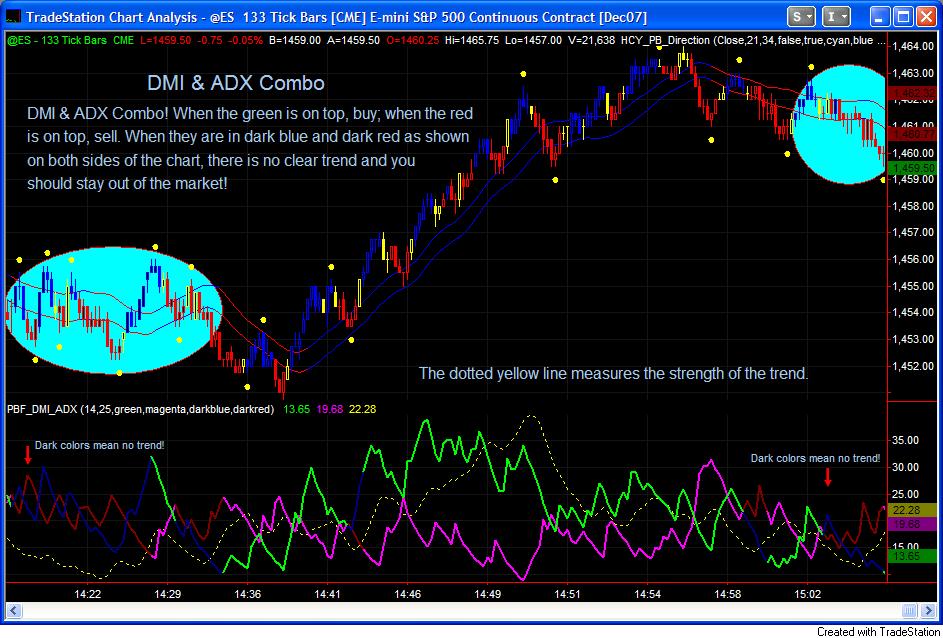
Below are 4 popular indicators: RSI, CCI, Momentum and DMI_ADX indicators. They come with any popular trading platforms free of charge. The problem is, they often look very choppy and difficult to interpret. You can't trade with an indicator that is all over the places. This modified version takes care of the problem. Look at the charts below and compare the default TradeStation version and the PBF_ version. Never trade with the choppy indicators again! The DMI_ADX indicator is only color-coded without modification on its value.
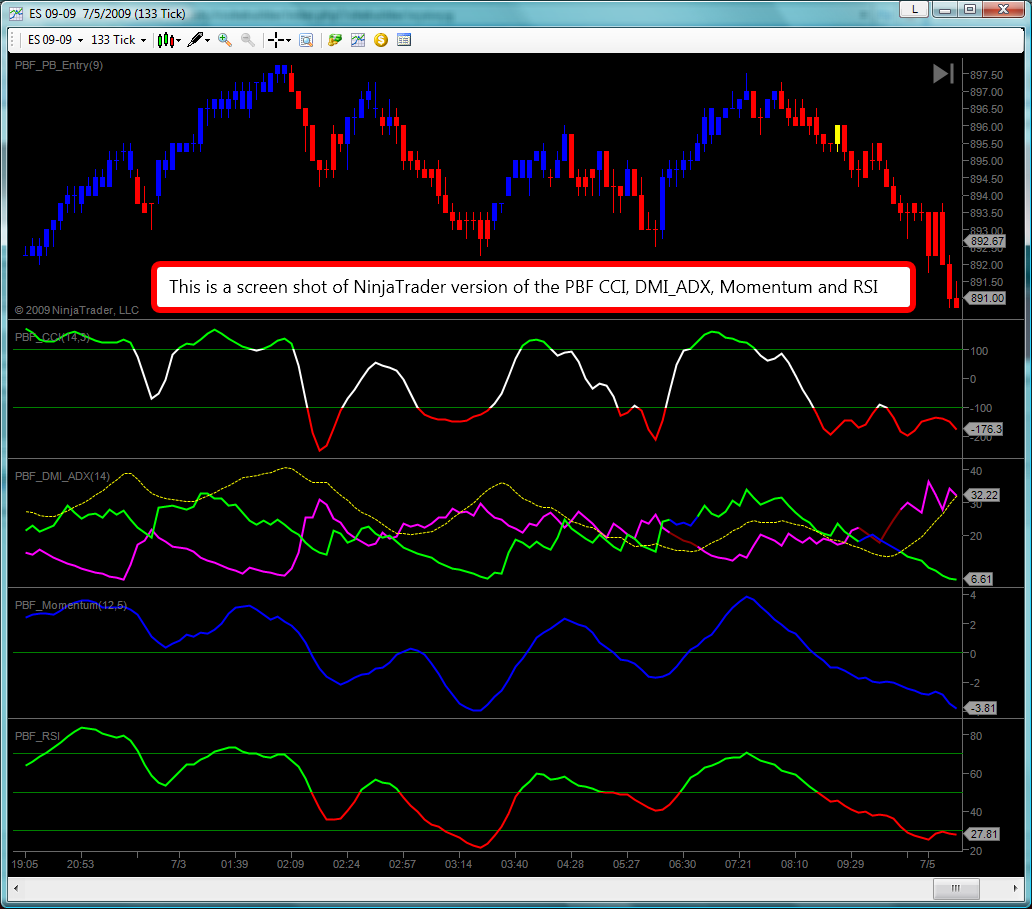
Above is a screen shot of the NinjaTrader version of the 4 indicators. Note the "gradient" coloring method is not available in the C# coding language for NinjaTrader, we can only plot the Momentum indicator in one color.
RSI Modified ($FREE with the purchase of the Moving Averages)
CCI Modified ($FREE with the purchase of the PBF_OSOB Indicator)
The Momentum Indicator Modified ($FREE with the purchase of the PBF_Trend_Bars)
DMI & ADX Combo ($FREE with the purchase of the iTunnel) Color-coded. Stay on the right side of the market.
Disclaimer: All TRADING involves risk, while there is a potential to make a substantial amount of money, you CAN LOSE a substantial amount of money as well, no matter what method you use. All trading involves risk; past performance is not necessarily indicative of future results.
Commission Rule 4.41(b)(1)(I) hypothetical or simulated performance results have certain inherent limitations. Unlike an actual performance record, simulated results do not represent actual trading. Also, since the trades have not actually been executed, the results may have under- or over-compensated for the impact, if any, of certain market factors, such as lack of liquidity. Simulated trading programs in general are also subject to the fact that they are designed with the benefit of hindsight. No representation is being made that any account will or is likely to achieve profits or losses similar to those shown.
ONE OF THE LIMITATIONS OF HYPOTHETICAL PERFORMANCE RESULTS IS THAT THEY ARE GENERALLY PREPARED WITH THE BENEFIT OF HINDSIGHT. IN ADDITION, HYPOTHETICAL TRADING DOES NOT INVOLVE FINANCIAL RISK, AND NO HYPOTHETICAL TRADING RECORD CAN COMPLETELY ACCOUNT FOR THE IMPACT OF FINANCIAL RISK IN ACTUAL TRADING. FOR EXAMPLE, THE ABILITY TO WITHSTAND LOSSES OR TO ADHERE TO A PARTICULAR TRADING PROGRAM IN SPITE OF TRADING LOSSES ARE MATERIAL POINTS WHICH CAN ALSO ADVERSELY AFFECT ACTUAL TRADING RESULTS. THERE ARE NUMEROUS OTHER FACTORS RELATED TO MARKETS IN GENERAL OR TO THE IMPLEMENTATION OF ANY SPECIFIC TRADING PROGRAM WHICH CANNOT BE FULLY ACCOUNTED FOR IN THE PREPARATION OF HYPOTHETICAL PERFORMANCE RESULTS AND ALL OF WHICH CAN ADVERSELY AFFECT ACTUAL TRADING RESULTS.
THERE IS RISK OF LOSS IN ALL TRADING. PAST PERFORMANCE IS NOT INDICATIVE OF FUTURE RESULTS. ALL RESULTS ARE HYPOTHETICAL. NO IMPLICATION IF BEING MADE THAT ANYONE UTILIZING ANY OF THE INDICATORS OF PAINTBARFACTORY.COM HAS OR CAN OBTAIN SUCH PROFITS AND RESULTS. THE INFORMATION SUPPLIED ON THIS WEBSITE IS MERELY A PRESENTATION OF TRADING TOOLS AND STRATEGIES, FOR INSTRUCTIONAL AND EDUCATIONAL PURPOSES ONLY.
This is not a prospectus; no offer on our part with respect to the sale or purchase of any securities is intended or implied, and nothing contained herein is to be construed as a recommendation to take a position in any market. The material presented herein has been obtained or derived from sources believed to be accurate, but we do not guarantee its accuracy or completeness. There have been no promises, guarantees or warranties suggesting that any trading will result in a profit or will not result in a loss. The TRADER is responsible for his own actions.
|
|
|