Customers' Trades
A few customers like to send us their charts and share what they have achieved. We'd like to share them with you as well. If you made a trade you like to share, please email the chart to us, and we will post it here. Please write your comments directly on the chart, and make sure the size is not too big. Thank you!
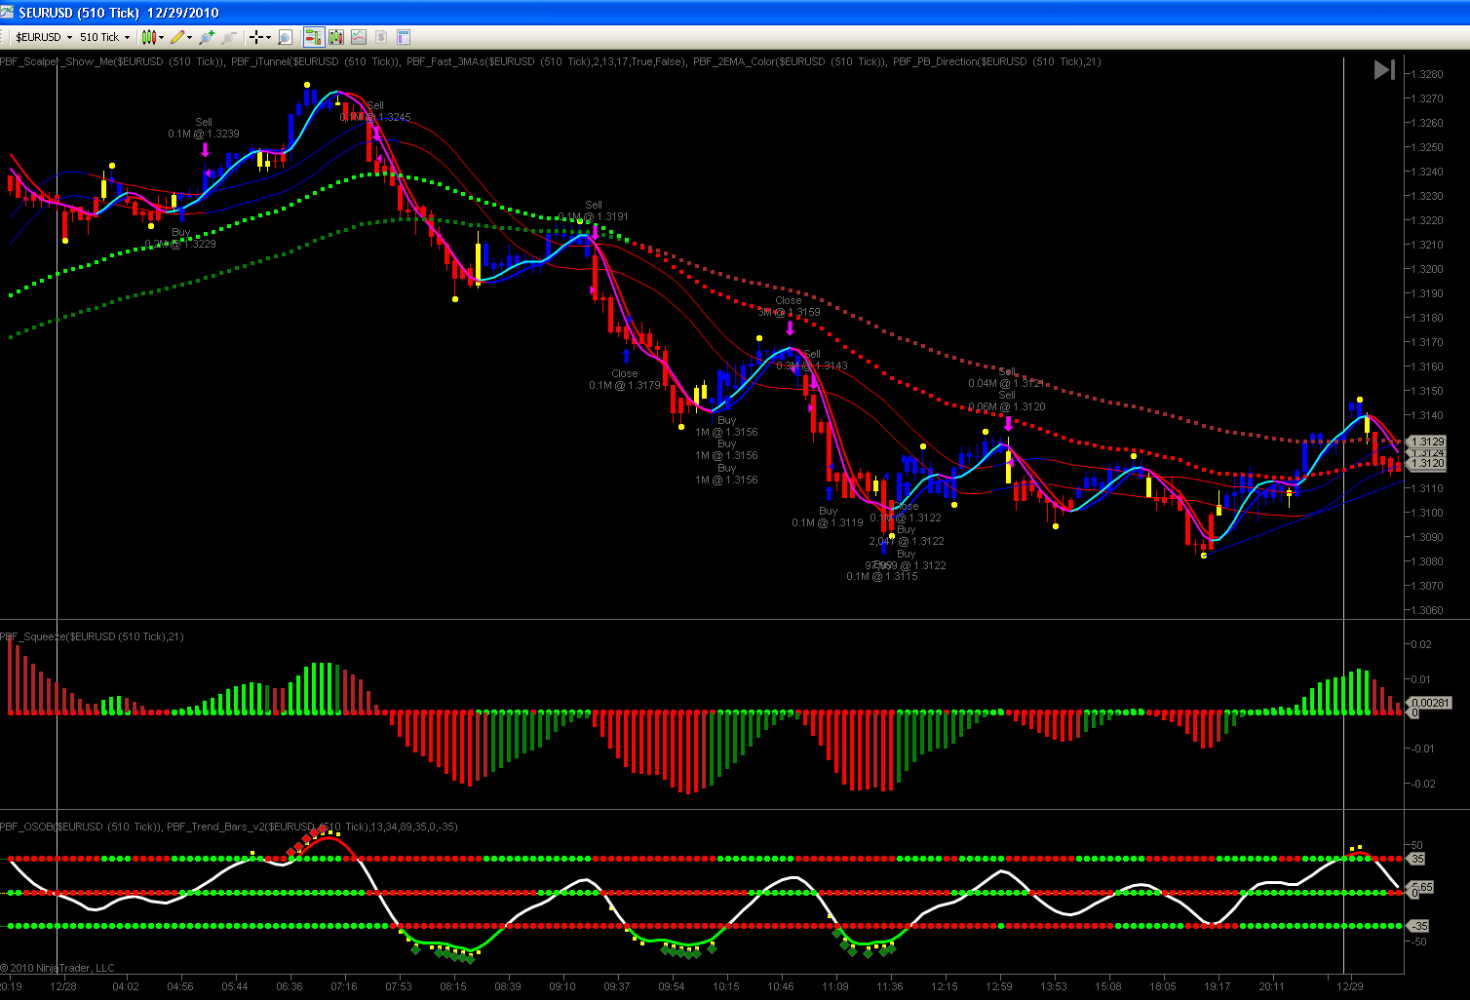
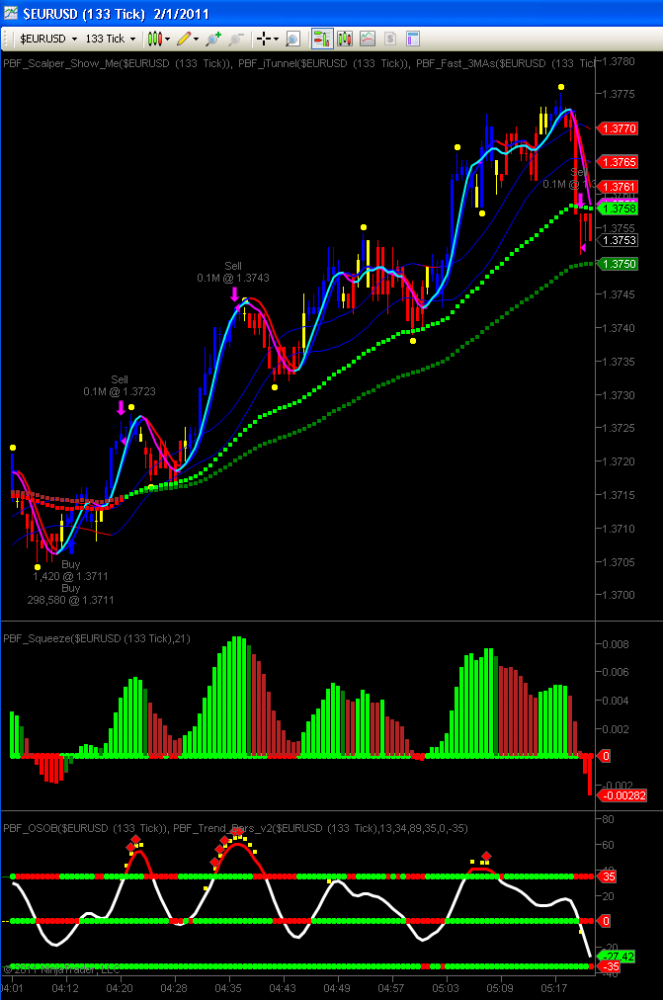
Dear Sebastian,
I just wanted to share some of my advances on the daytrading thing... I have been for the last 7 days staring at charts, finding, looking, understanding the whole intricated relationships while fighting with my own self in terms of patience, discipline and other human emotional responses in order to trade well... In fact I think the holidays are the perfect time to just do this as you SHOULD sit on your hands like the whole day and MAYBE just one trade will fullfil the conditions to be traded.
An exception to this just happened yesterday on the EUR/USD (attached is the screenshot) and this was THE eye opener for me... of course my trading was far from optimum (did not let the winners run) BUT I did not have a single loser! (1 break even trade only).
Finally I understood HOW I have to trade this and also WHY I feel frustrated which then leads me to do BAD trades.
Now I have to find my Risk/trade management and work very hard on my Personal traits like being patient and wait only for the best trade even if I spend the whole trading session sitting in front of the computer without making a single trade. Now that I write this, it is obvious isnt it?, If the system does not trigger any trades is exactly because we shall not be trading at all!...
I am very happy about all this and that is why I needed to share it with you...
Happy holidays and thanks for the amazing help you have been giving me...
Gustav, Switzerland
A month later, the chart below was sent by Gustav. Obviously he is getting better and better. Great entry, almost no drawdown. He began to peel off near the highs of each swing, and was able to hold the runner much longer. My advice to him was, he can scale in, too!
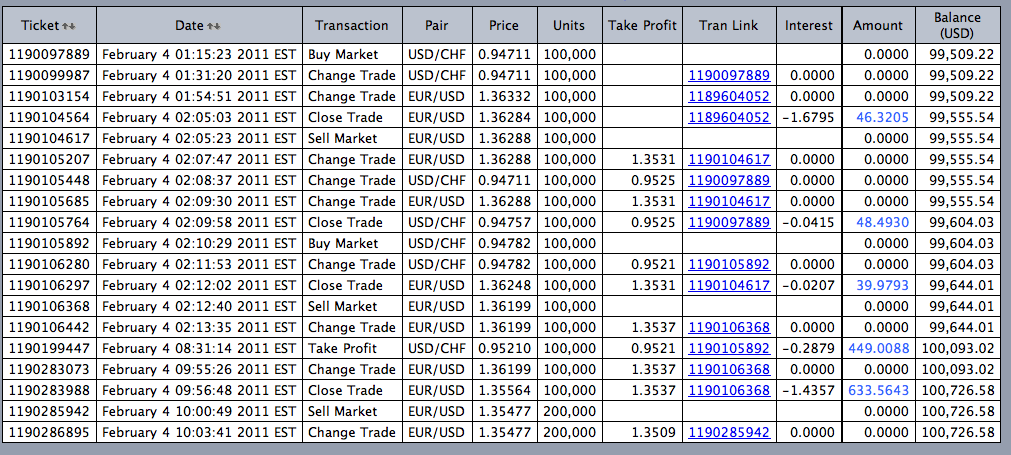
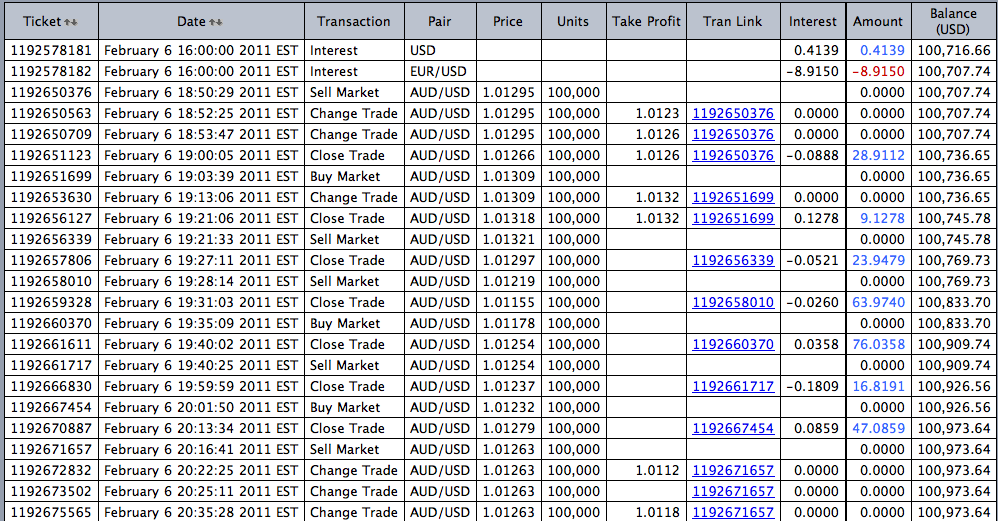
Dear Sebastian,
I just wanted to show you what you have done for me... all the tons of emails we exchanged on december and how much was I "ballbreaking" you with dumb questions... you have no idea how valuable is for me that you are mentoring and tutoring me... and believe me there is nothing I hate more than making other people lose their valuable time ( I hate when people make me lose my time) ... so for that I am grateful that you invested some of your time on me...
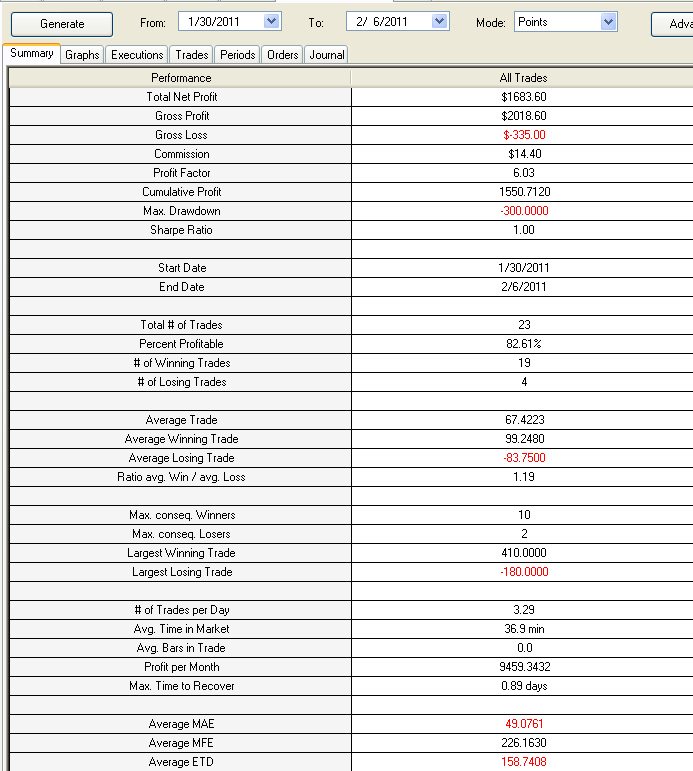
Attached is a screenshot of my ninjatrader daytrading paper account statement after finally having the "click"... granted it is just the first week that I had time to paper trade like I SHOULD TRADE but the results are for me very encouraging and tells me that I am doing things right.... I know there is still many things that I need to master but I am on it!
Of course your feedback is really important to me... and of course this is just starting... since I am working a 9/5 job it is really a shame that I cannot really do this every day to gain experience faster... but as you can see today is Sunday and it is a very sunny and beautiful day which I could be skiing in the mountains but no I am in front of my PC glued to my charts learning and becoming better and better... :D so someday I can proudly represent you as one of your winner students :)
Anyways... I wish you a great weekend... and again thanks so much!
p.s: now I am getting an amazing feeling... is like having an amazing superpower. If we combine Stock trading, Advanced option trading and daytrading.... then I can really really sleep very well!... I can see how I can ALWAYS have some income monthly from different sources if any of them is not working on my favor.... exciting!
Gustav, Switzerland
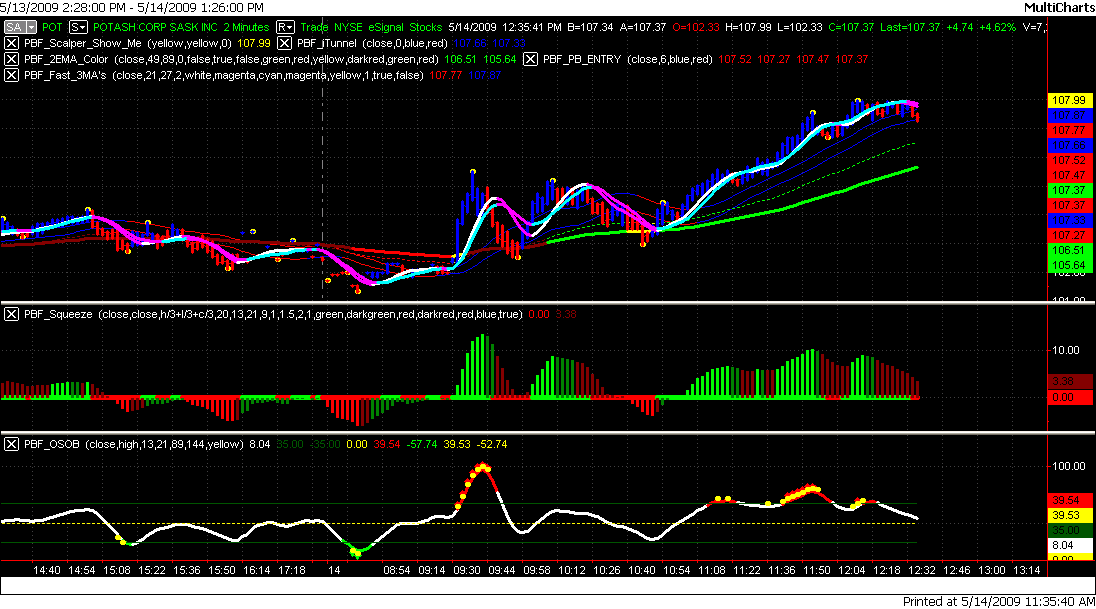
I'm loving your indicators Sebastian!
Here are another nice run of trades on the 1 minute charts from Sunday evening. I'm liking this.
Marvin L.
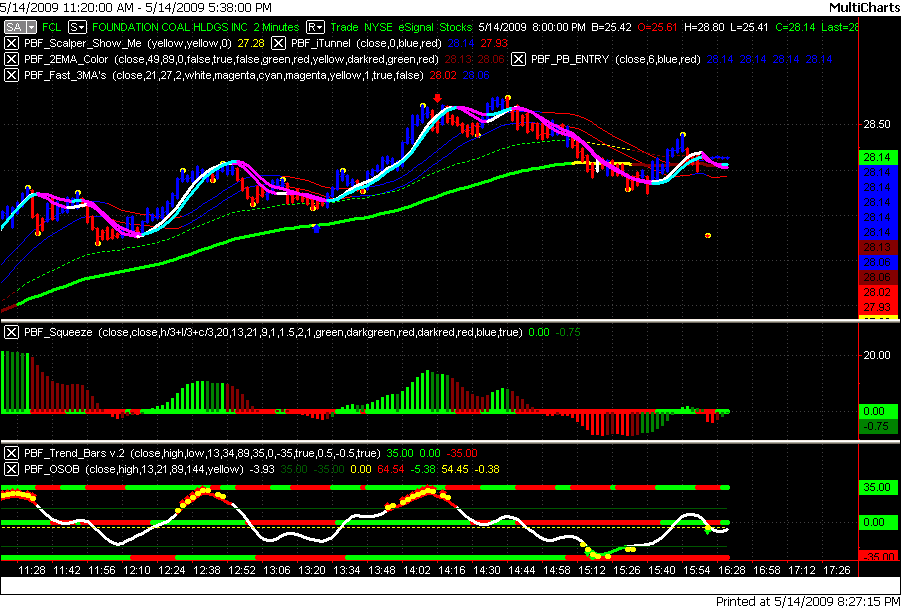
Hey PBF,
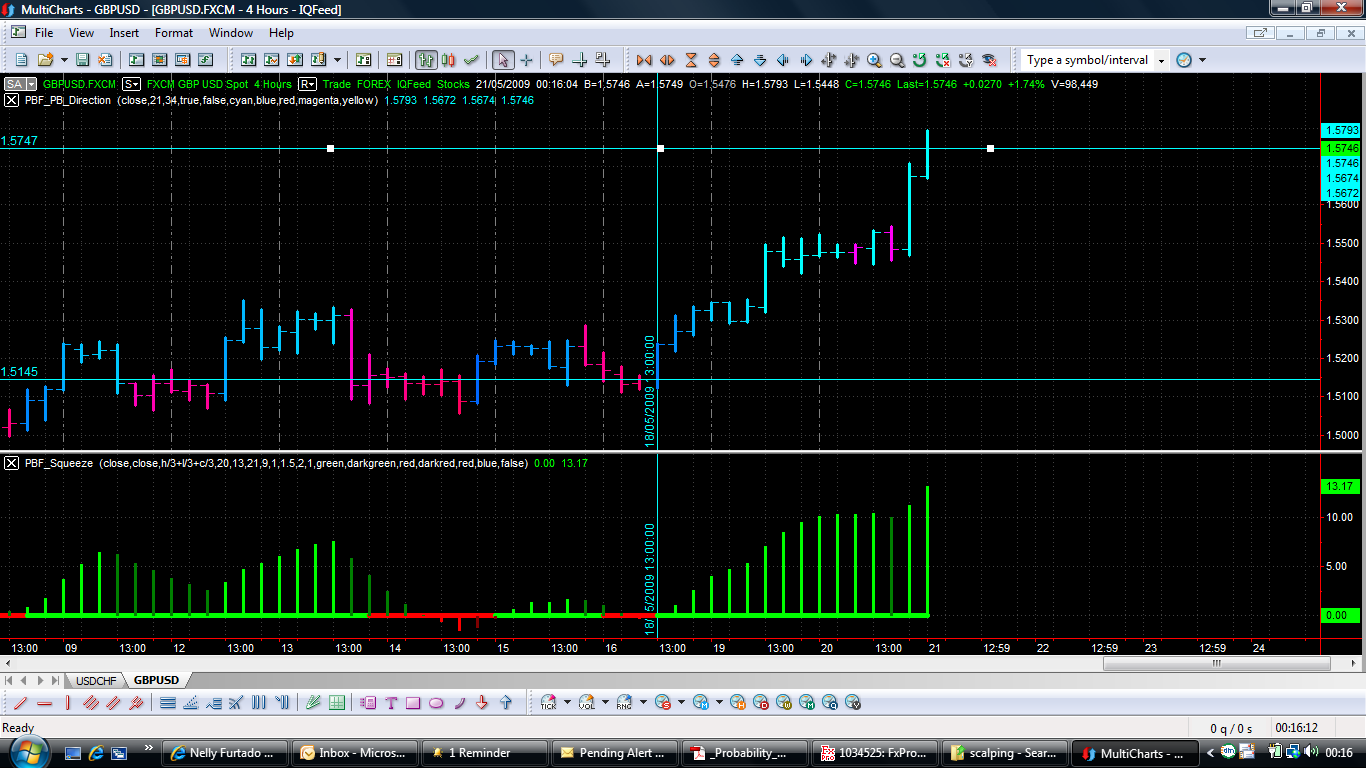
Hope you are well. Check this out! 600 pips! J J J J I’d stick that on your site – I know you hate long time frames but your indicators RULE on them!
What I love the most is that the fundamental and technical pundits say it’s going one way, other indicators say it’s going one way – the Squeeze says no and is almost always right. Genius.
Hi PBF!
I think I found my answer to the rambling question I sent you earlier! (Sorry about that! Bad cold!)
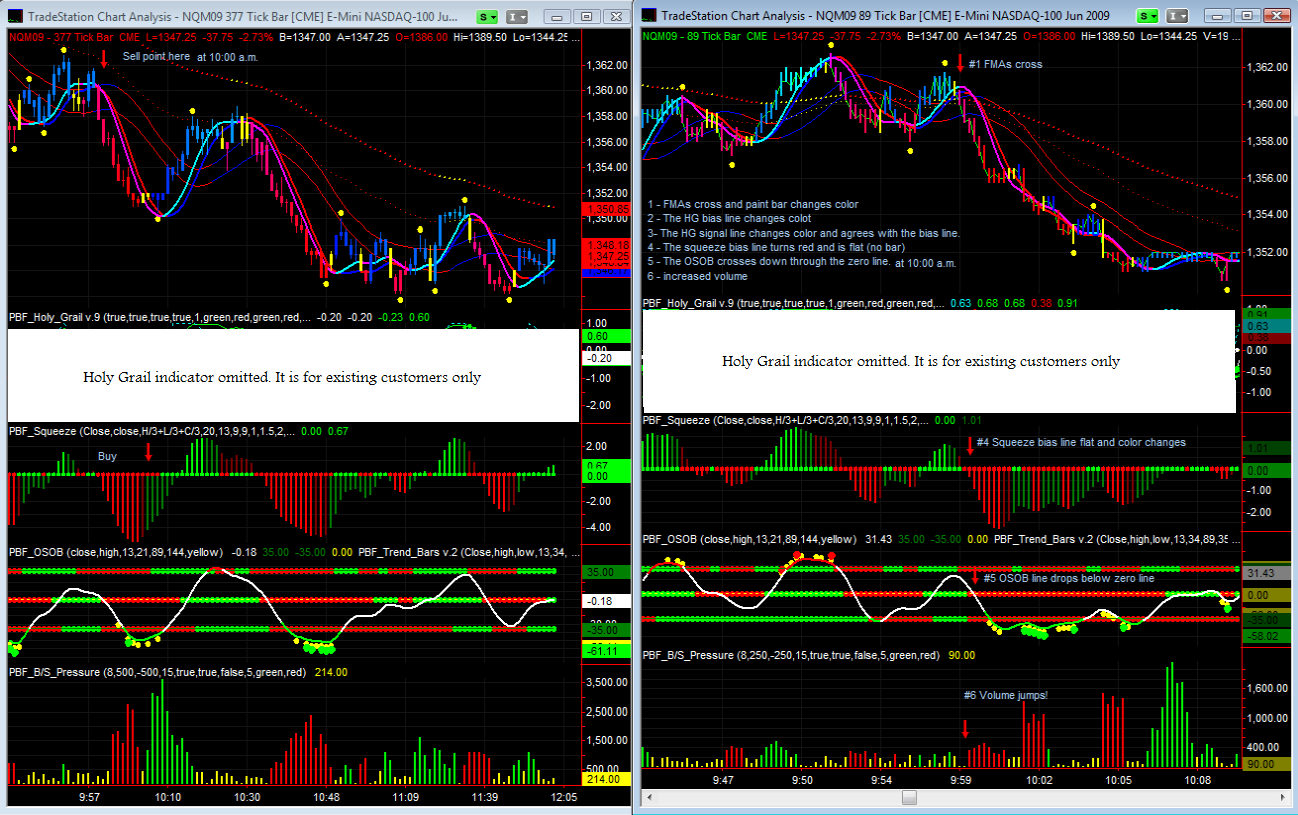
Anyhow, I tried to describe it on these charts, but here’s the written explanation:
Entering the trade to sell:
1st: the 377 T chart shows a possible down move (especially if you had drawn support line through the prior scalper dots, which I didn’t show here). Also, the OSOB line is flat and heading down.
2ND Switching to the 89 T chart, I’m lookin for the following step-up to occur:
The FMAs cross and the paint bar changes color.
The HG bias line changes color.
The HG signal line changes color.
The Squeeze bias line turns red but remains flat (no bar).
The OSOB crosses down through the other side of the zero line
The volume increases.
Exiting the trade with a buy:
The 377 T chart Squeeze bar changes color.
The 377T chart OSOB is showing a bottom.
Total Profit = 7 points!
The best part is the little risk:
Sold to Open: 1358.00 (open) 1358.25 (high)
Bought to Close: 1351.25 (Open and Low)
hit this stock two day in a row 3000.00 buckaroos,awsume software
Yes you sure can use my statements on your paintbar tools they are by best the only way to trade when stocks are moving or in a consolidation period and i wait for the brake either dirrection it awsome to say the least please post it its true thanks again Glenn B
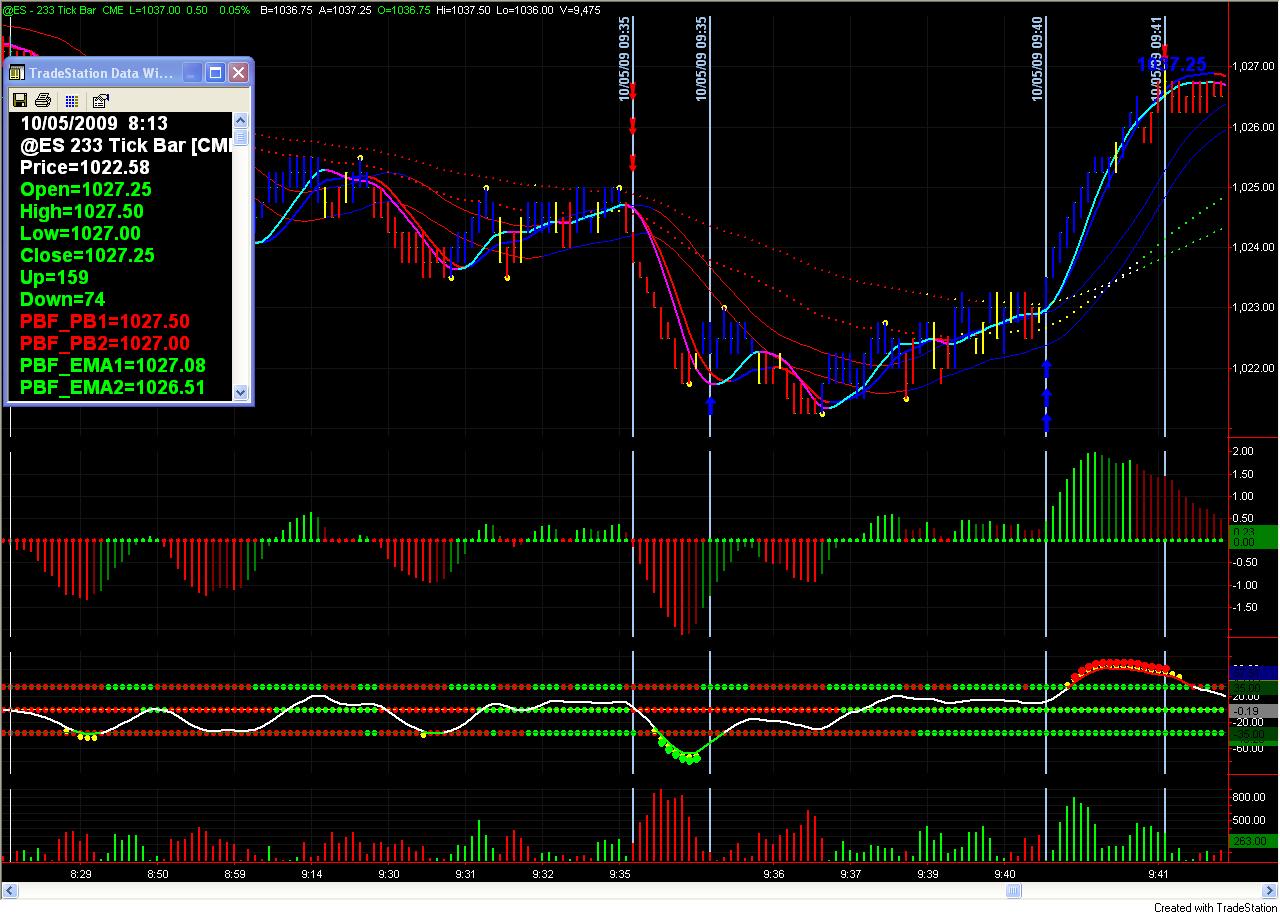
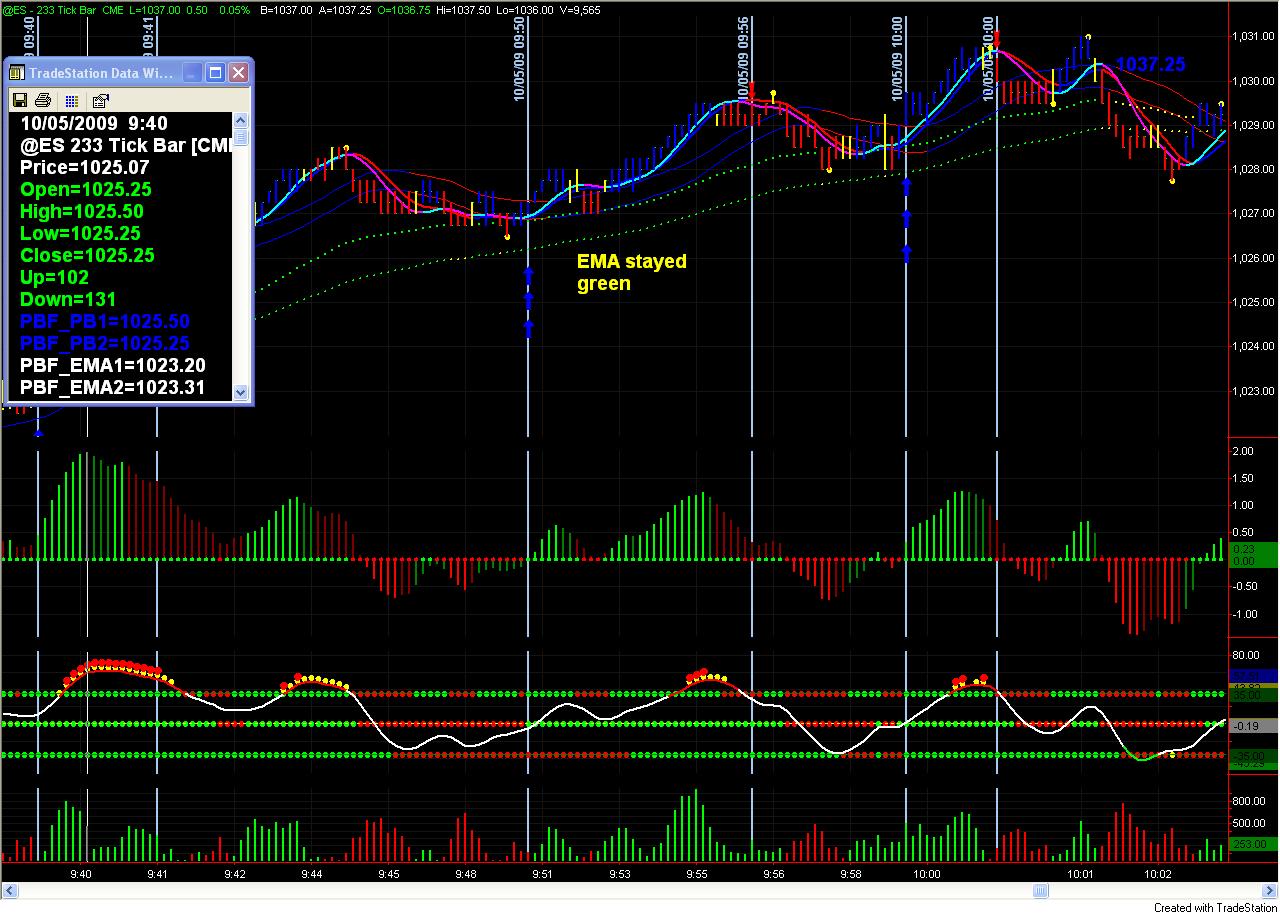
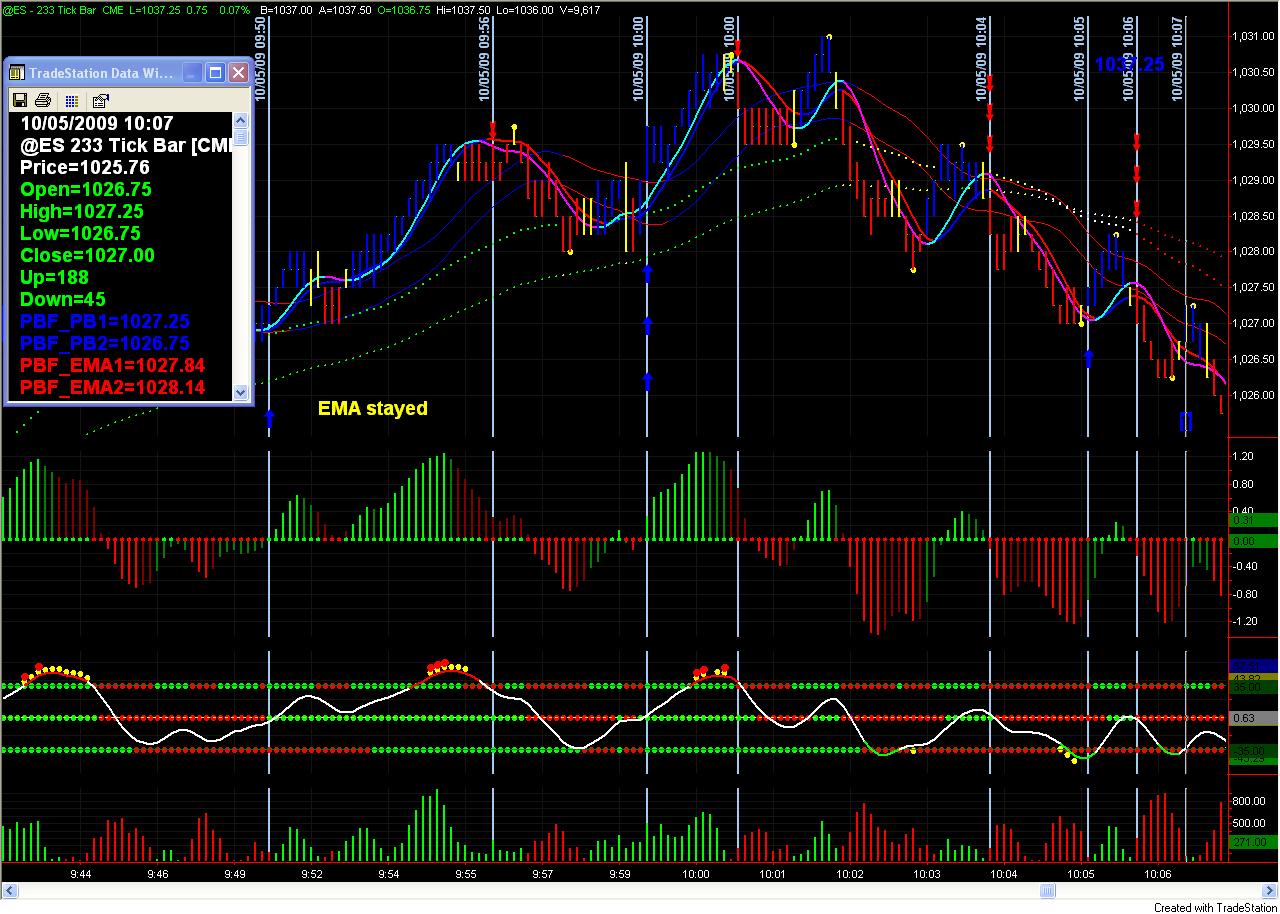
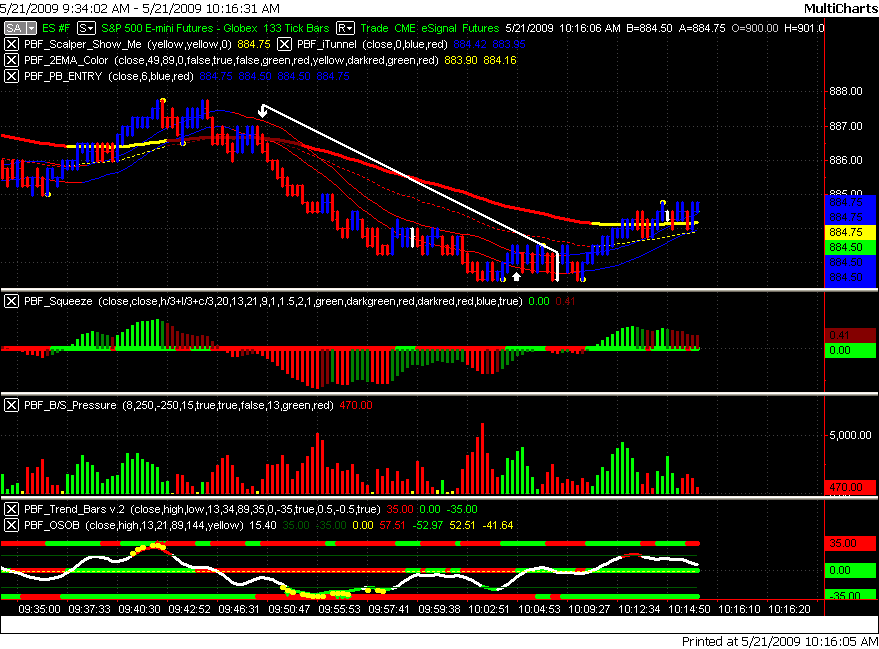
Thanks again for your quick response. I thought I had a decent morning (no losses). I'm enclosing 3 charts of my mornings activity on the S&P. I settled on the 233 tick chart. I try to stop trading by 11am eastern, and if needed, I'll go back in for the last 45 minutes. Regards, Mike G.
got in on this 1000 sharers .75 750.00 thanks
Just lov goin short when PB says so
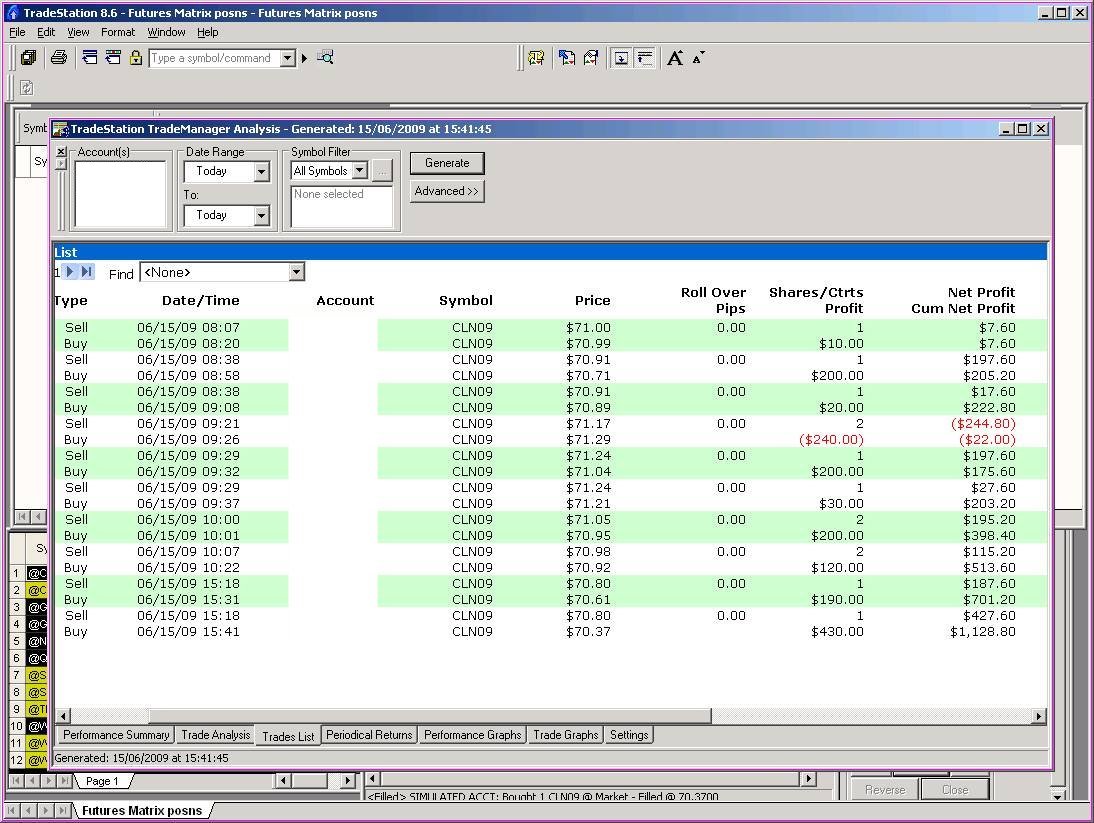
Hi:
Today I traded 1 or 2 contracts of Crude with my new 'simplified' TS setup of :
Subgraph 1) Price + 2 x EMA, FMA, and PB_Direction
Subgraph 2) Squeeze and BSP
Subgraph 3) Holy Grail
Please see the attached TS TradeManager Analysis sheet for today's trades - 5 winning trades out of 6! OK, it was on the TS simulator (playing safe till I'm sure I can win consistently), so the fills are better than they would be for real. Thanks very much for these indicators, this wouldn't be happening without them.
Best Regards,
Max
Disclaimer: All TRADING involves risk, while there is a potential to make a substantial amount of money, you CAN LOSE a substantial amount of money as well, no matter what method you use. All trading involves risk; past performance is not necessarily indicative of future results.
Commission Rule 4.41(b)(1)(I) hypothetical or simulated performance results have certain inherent limitations. Unlike an actual performance record, simulated results do not represent actual trading. Also, since the trades have not actually been executed, the results may have under- or over-compensated for the impact, if any, of certain market factors, such as lack of liquidity. Simulated trading programs in general are also subject to the fact that they are designed with the benefit of hindsight. No representation is being made that any account will or is likely to achieve profits or losses similar to those shown.
ONE OF THE LIMITATIONS OF HYPOTHETICAL PERFORMANCE RESULTS IS THAT THEY ARE GENERALLY PREPARED WITH THE BENEFIT OF HINDSIGHT. IN ADDITION, HYPOTHETICAL TRADING DOES NOT INVOLVE FINANCIAL RISK, AND NO HYPOTHETICAL TRADING RECORD CAN COMPLETELY ACCOUNT FOR THE IMPACT OF FINANCIAL RISK IN ACTUAL TRADING. FOR EXAMPLE, THE ABILITY TO WITHSTAND LOSSES OR TO ADHERE TO A PARTICULAR TRADING PROGRAM IN SPITE OF TRADING LOSSES ARE MATERIAL POINTS WHICH CAN ALSO ADVERSELY AFFECT ACTUAL TRADING RESULTS. THERE ARE NUMEROUS OTHER FACTORS RELATED TO MARKETS IN GENERAL OR TO THE IMPLEMENTATION OF ANY SPECIFIC TRADING PROGRAM WHICH CANNOT BE FULLY ACCOUNTED FOR IN THE PREPARATION OF HYPOTHETICAL PERFORMANCE RESULTS AND ALL OF WHICH CAN ADVERSELY AFFECT ACTUAL TRADING RESULTS.
THERE IS RISK OF LOSS IN ALL TRADING. PAST PERFORMANCE IS NOT INDICATIVE OF FUTURE RESULTS. ALL RESULTS ARE HYPOTHETICAL. NO IMPLICATION IF BEING MADE THAT ANYONE UTILIZING ANY OF THE INDICATORS OF PAINTBARFACTORY.COM HAS OR CAN OBTAIN SUCH PROFITS AND RESULTS. THE INFORMATION SUPPLIED ON THIS WEBSITE IS MERELY A PRESENTATION OF TRADING TOOLS AND STRATEGIES, FOR INSTRUCTIONAL AND EDUCATIONAL PURPOSES ONLY.
This is not a prospectus; no offer on our part with respect to the sale or purchase of any securities is intended or implied, and nothing contained herein is to be construed as a recommendation to take a position in any market. The material presented herein has been obtained or derived from sources believed to be accurate, but we do not guarantee its accuracy or completeness. There have been no promises, guarantees or warranties suggesting that any trading will result in a profit or will not result in a loss. The TRADER is responsible for his own actions.
|
|
|