Indicators on this page are bonuses WITH purchase of another indicator only
HeatMeter ($FREE with the purchase of the iTunnel, compare with $395/month one company is leasing)
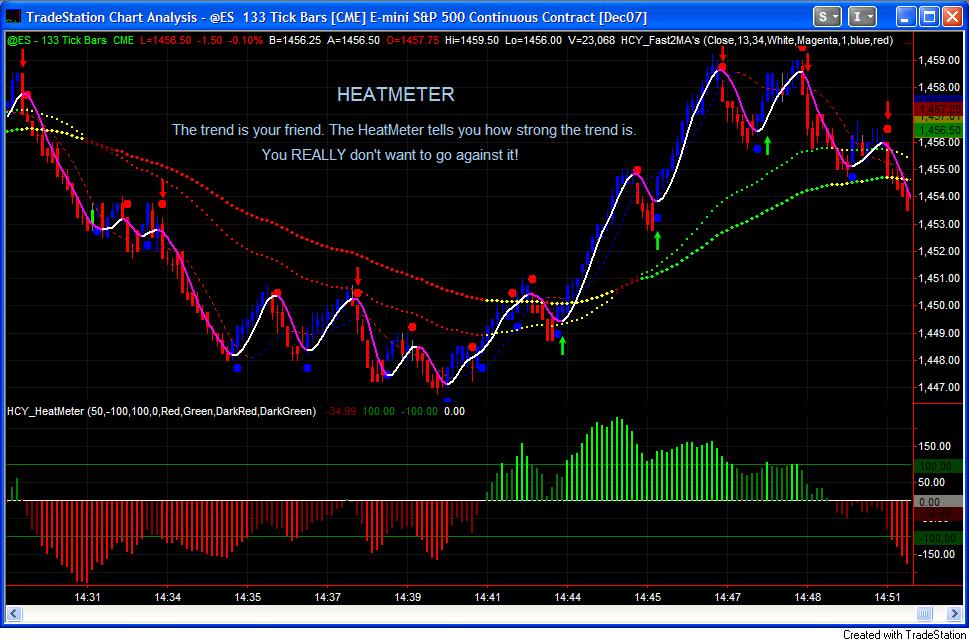
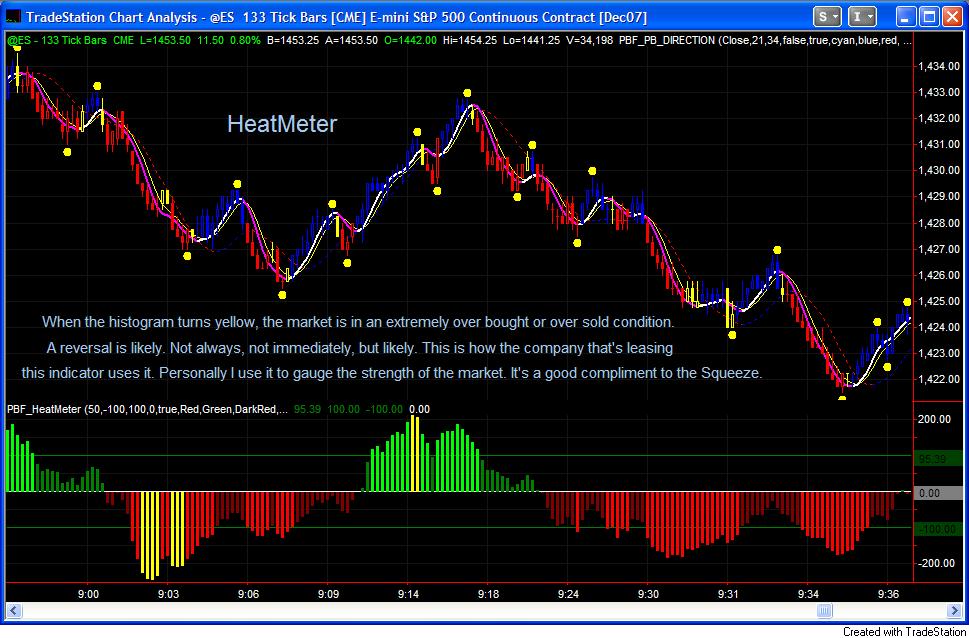
This indicator and the iTunnel are similar to part of the indicator package one company is leasing for $395 a month (as of the writing of this description). In fact, this indicator can be exactly the same if you just change the setting to a different number. It tells you the strength of the trend, gives you a directional bias. You really don’t want to go long when it’s red, or go short when it is green. Because my friend, the trend is your friend. Unless indicated by another indicator such as the Squeeze to tell you otherwise, you should always trade with the trend. This is how I interpret it. The company that is leasing it uses it to gauge the possibility of a trend reversal. But honestly, I have a better and more precise way: The Squeeze!
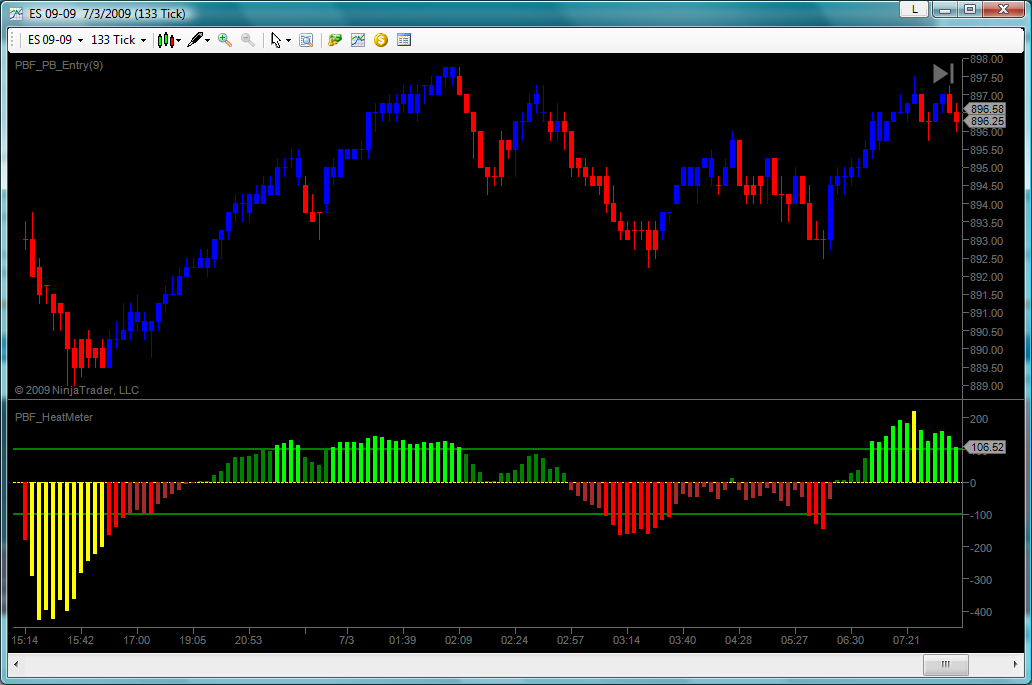
Here is a screen shot of the NinjaTrader version of the HeatMeter.
Buy/Sell Pressure ($FREE with the purchase of the Squeeze Indicator)
Here is one indicator that’s included in a package one company is selling for hundreds, and they don’t even have as many “styles” as I have. That really doesn’t matter, as only one style is really useful, which they don’t have.
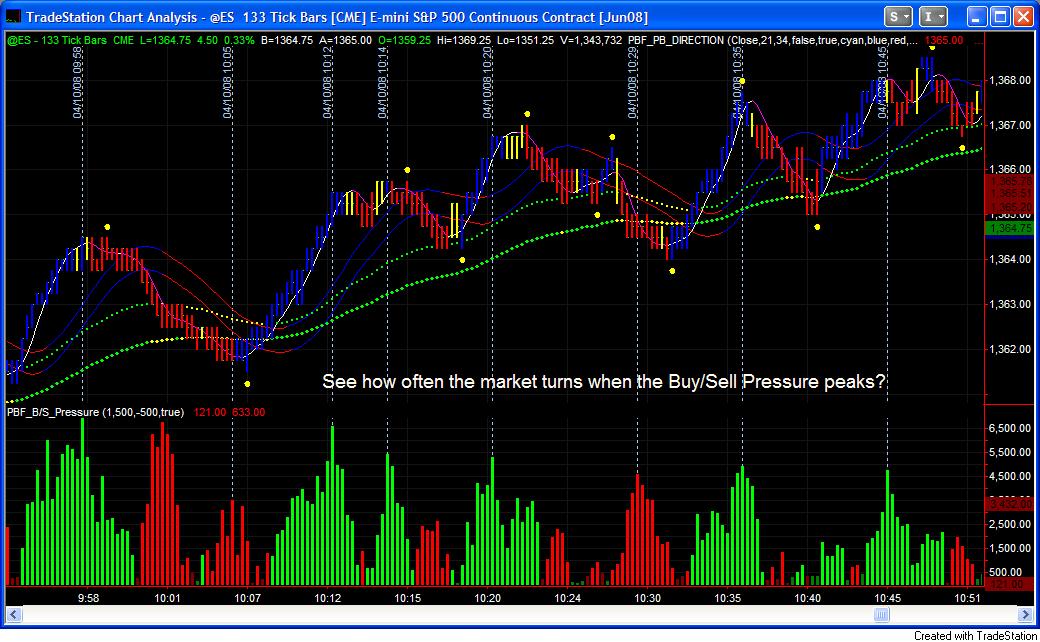
I am a big fan of Buy/Sell Pressure. The law of supply and Demand is what’s moving the market. When there are more buying than selling, the price goes up. When the sellers outnumber the buyers, the market goes down. Simple as that.
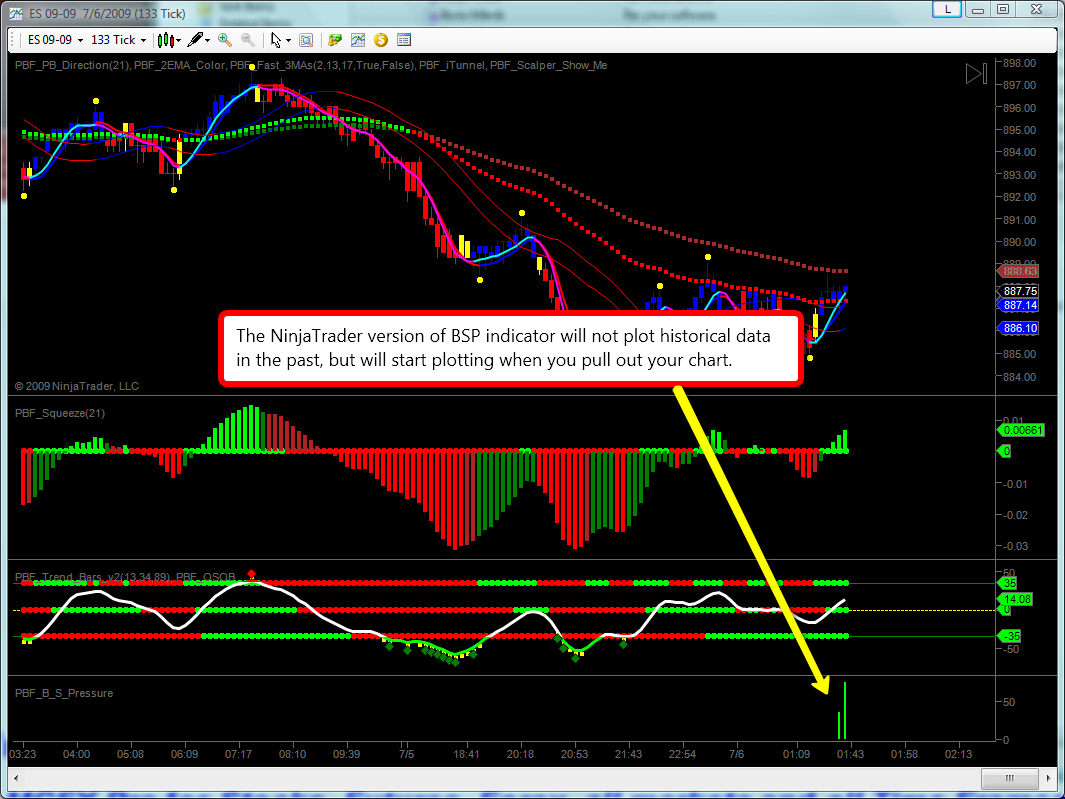
Below is a chart illustrating how the Buy Sell Pressure indicator works on NinjaTrader platform. It will not ploat historical data in the past, but will start plotting from the first bar when you pull out the chart. Only ONE style of the Buy Sell Pressure is available for NinjaTrader version for the same reason.
Below is a chart illustrating how the Buy Sell Pressure indicator works on NinjaTrader platform. It will not ploat historical data in the past, but will start plotting from the first bar when you pull out the chart. Only ONE style of the Buy Sell Pressure is available for NinjaTrader version for the same reason.
Below is a chart illustrating how the Buy Sell Pressure indicator works on NinjaTrader platform. It will not ploat historical data in the past, but will start plotting from the first bar when you pull out the chart. Only ONE style of the Buy Sell Pressure is available for NinjaTrader version for the same reason.
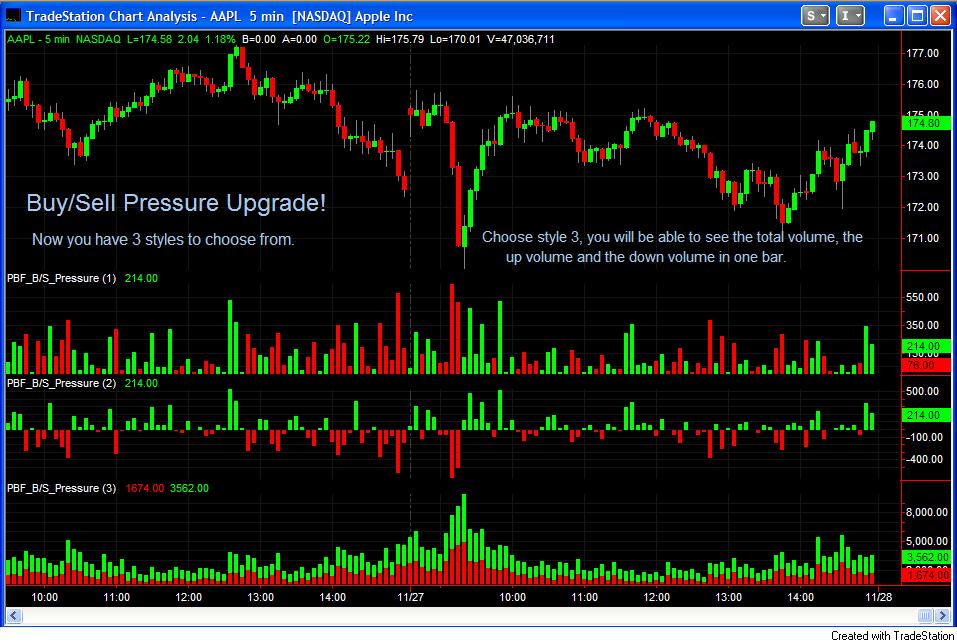
For TradeStation and MultiCharts version, we coded it in a way that you can choose between several different styles. See charts below. Only works on intraday charts. For daily, weekly and monthly charts, you only get the total volume of the day/week/month.
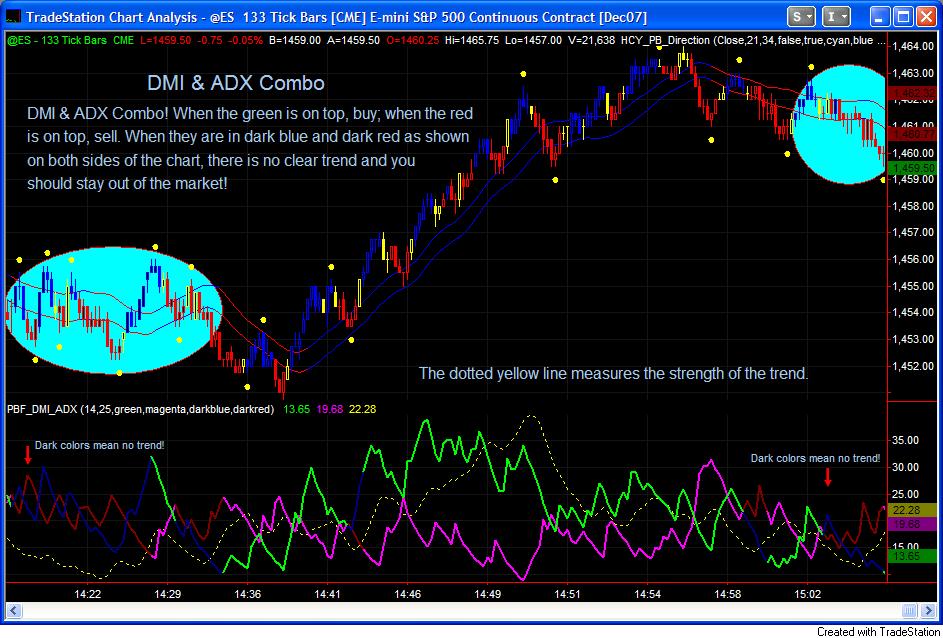
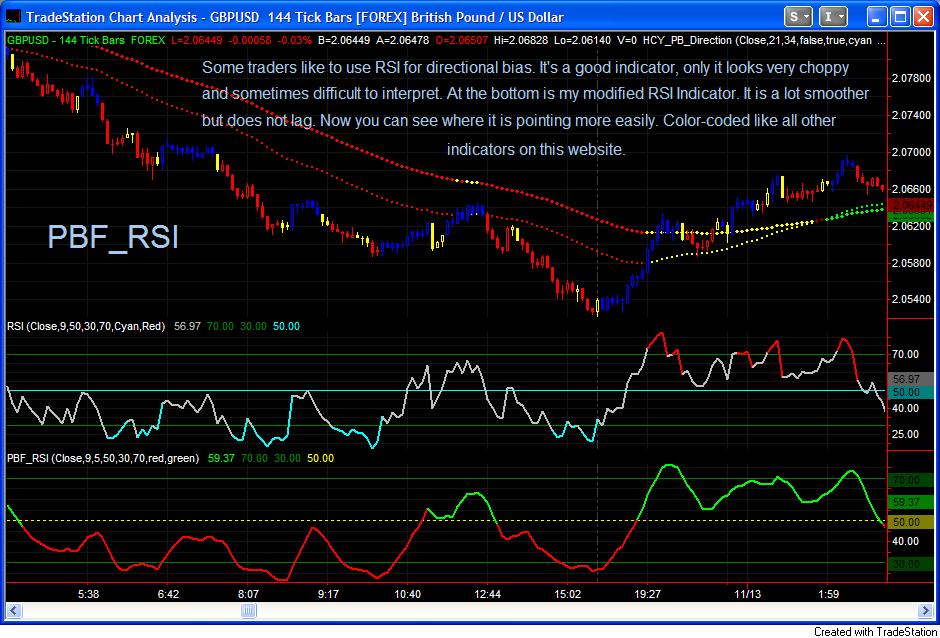
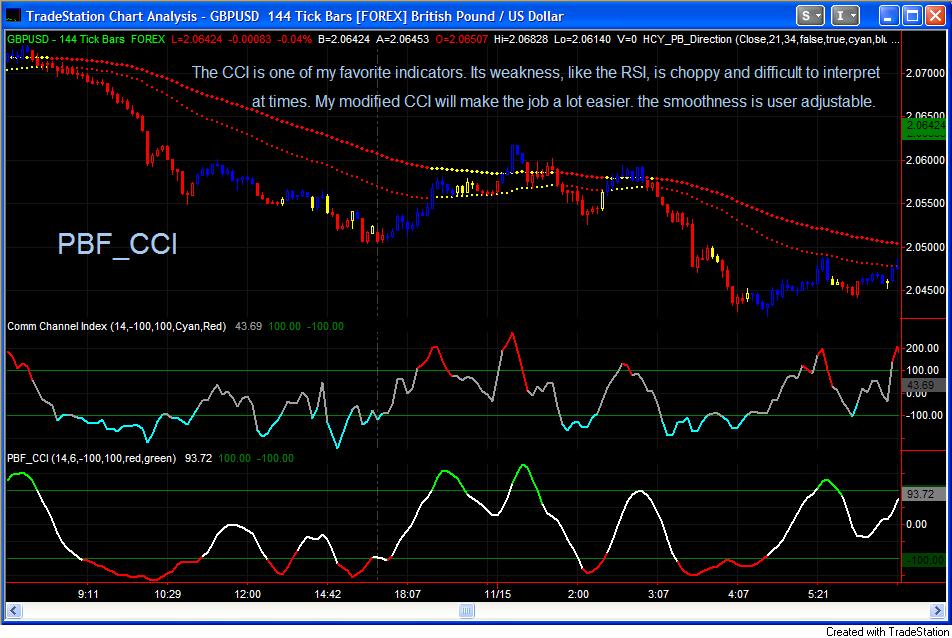
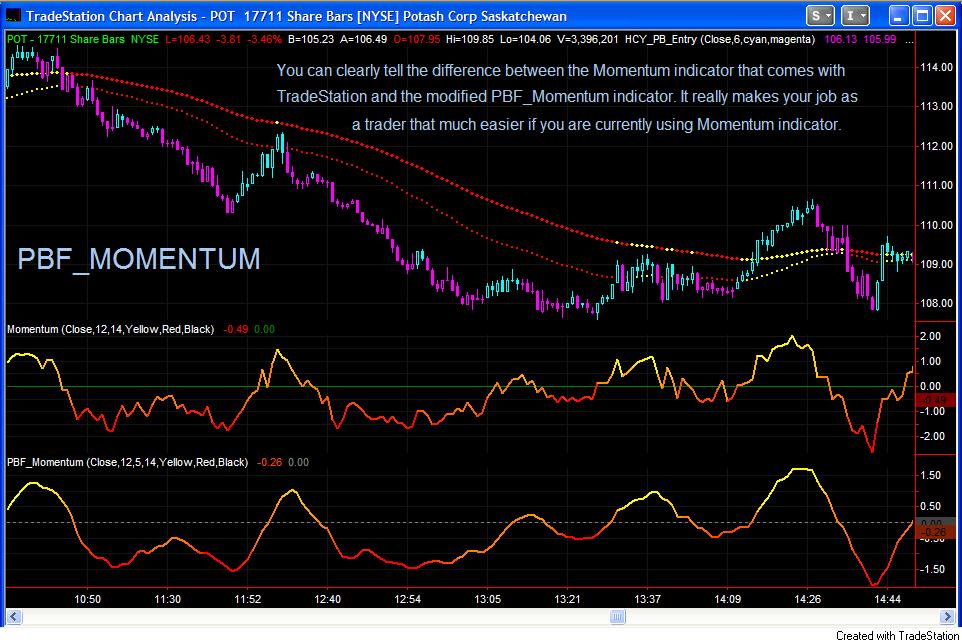
Below are 4 popular indicators: RSI, CCI, Momentum and DMI_ADX indicators. They come with any popular trading platforms free of charge. The problem is, they often look very choppy and difficult to interpret. You can’t trade with an indicator that is all over the places. This modified version takes care of the problem. Look at the charts below and compare the default TradeStation version and the PBF_ version. Never trade with the choppy indicators again! The DMI_ADX indicator is only color-coded without modification on its value.
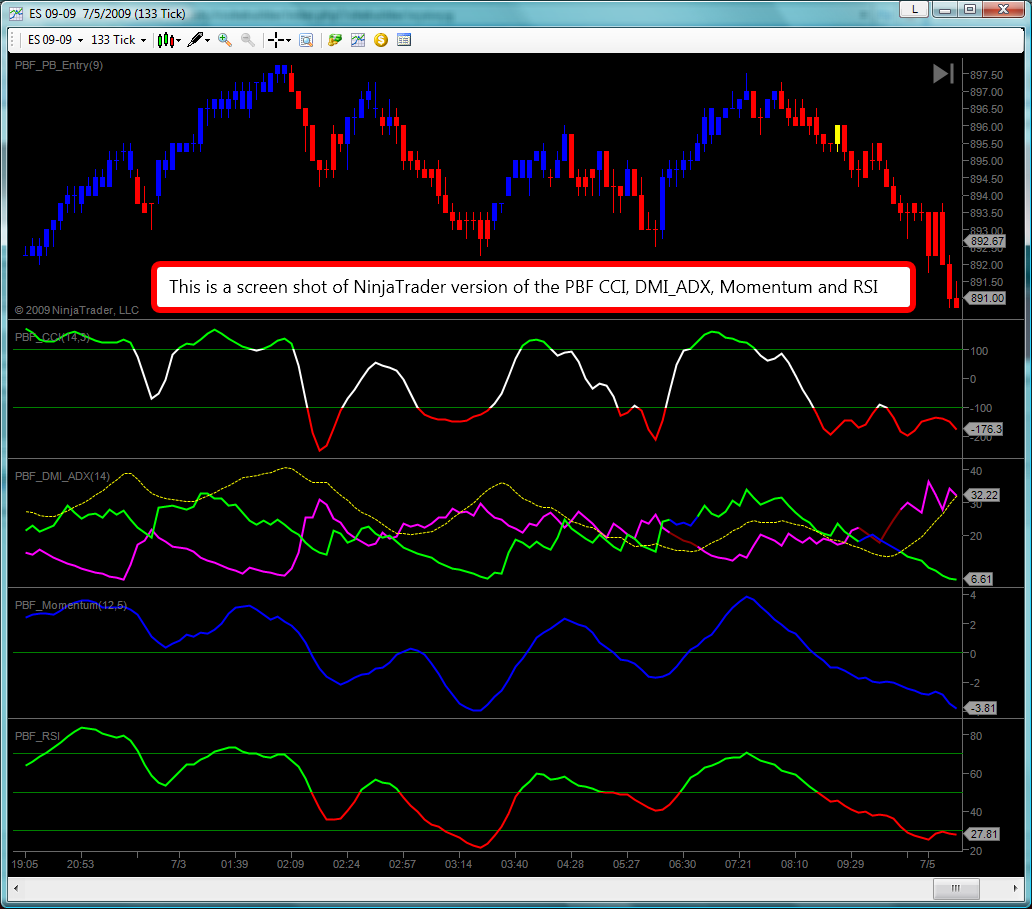
Above is a screen shot of the NinjaTrader version of the 4 indicators. Note the “gradient” coloring method is not available in the C# coding language for NinjaTrader, we can only plot the Momentum indicator in one color
RSI Modified($FREE with the purchase of the Moving Averages)
CCI Modified ($FREE with the purchase of the PBF_OSOB Indicator)
The Momentum Indicator Modified ($FREE with the purchase of the PBF_Trend_Bars)
DMI & ADX Combo ($FREE with the purchase of the iTunnel) Color-coded. Stay on the right side of the market.