You will read detailed description on every indicator we offer on this page, including the PBF Squeeze, Squeeze Radar Scanner, Moving Averages, iTunnel, OSOB and Trend_Bars. Please scroll down for more information. Free indicators that come with the purchase are under the “Bonus Indicator” page. Please also visit “Paint Bar”, “Show Me”, and “Holy Grail” pages for other tools we use.
The Squeeze ($497.00), get Buy/Sell Pressure for free plus a trading manual and the exclusive right to purchase the “Squeeze Radar Scanner” and “Holy Grail” indicator.
(Note: The Squeeze indicator is the one that occupies ONE subgraph sitting at the bottom of the charts. It does not include any other indicators such as moving averages, iTunnel, or any paint bar studies, Shoe Me dots shown on the charts. It comes with a trading manual in which we discuss the 3 setups for entry signals, 3 exit strategies, as well as many nuances such as when NOT to trade, and what are the setups. You also get full support from us if you need any.)
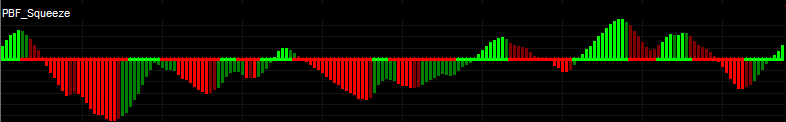
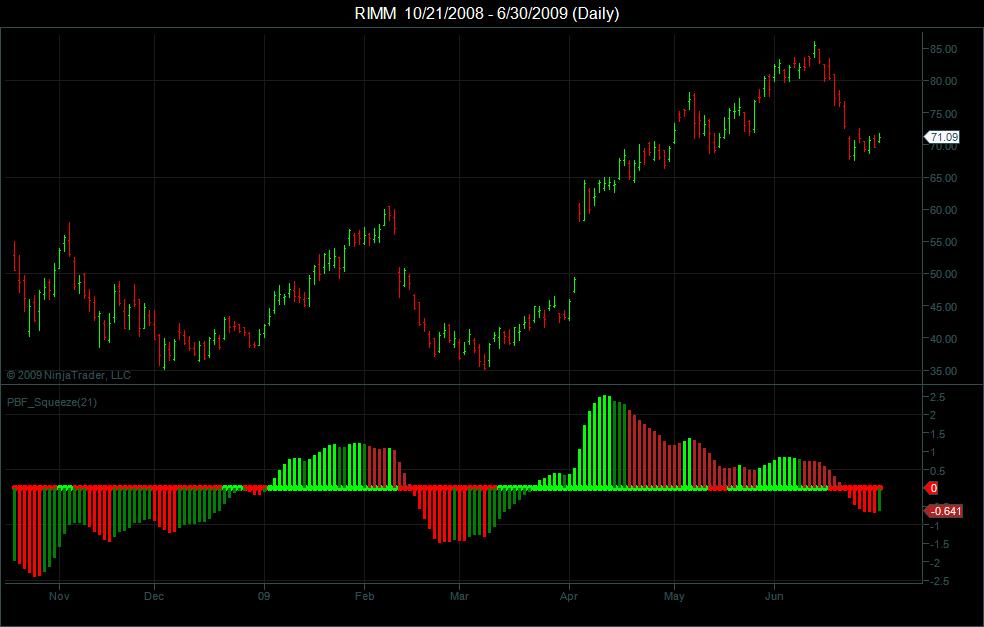
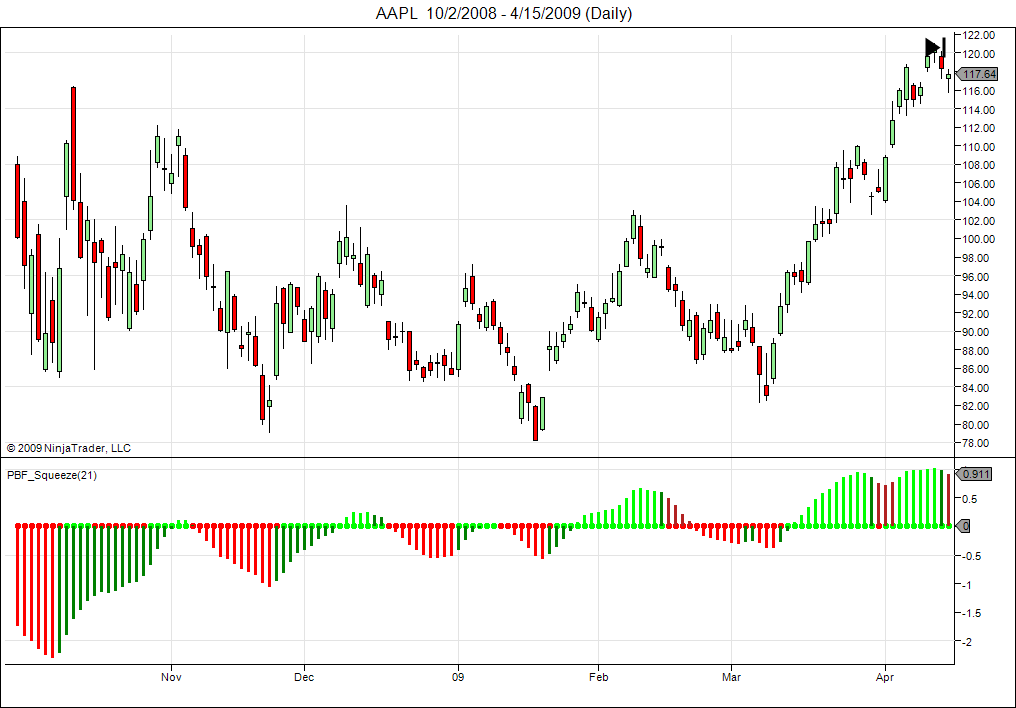
* The above screen shots were taken on NinjaTrader Platform showing the Squeeze indicator alone.
Many have asked what the differences are between our Squeeze indicator and the other popular and well-known Squeeze that’s been out there for years, which is retailed at $496. The simple answer is: Ours is much faster and way more precise, it is worth more than the extra $1 you are paying for. Our Squeeze indicator has absolutely nothing to do with the other Squeeze except for the name and similar formation (lines, dots, histograms, green, red, what else can you do?) We thought about using a different name, but we figured people will still think this is the same Squeeze indicator, why not go head to head with them from the beginning, so you can see what the differences really are? The idea and calculation behind our Squeeze is brand new. It does not employ the Momentum or CCI indicator, which are okay but not precise and responsive enough for our tastes. The “traditional” Bollinger Band/Keltner Channel idea that plots the middle line is kept alive if you choose 2 for “style” under “format technical analysis”, but we no longer use it in our trading. This idea sounds very attractive in theory, but if you really think about it and examine the charts, both Bollinger Band and Keltner Channel are lagging indicators. By the time the Bollinger Band moves inside the Keltner Channel, the market would have been moving sideways for at least a few bars. What’s worse is when the Bollinger Band moves outside of the Keltner Channel, the market has been moving for at least a few bars. If you enter positions then, that means you are a few bars too late. For this reason, we have re-designed the middle line, which has made tremendous differences in our trading, especially in the counter-trend mode.
Let us try to explain the differences in detail since this is the most asked question!
1. Histogram: The other Squeeze adapts the Momentum indicator for histograms. As mentioned earlier, it is not responsive or precise enough for our trading. The momentum can decrease many bars before the price actually drops, or the market can move slowly in one direction when there is no dominant momentum in one way or the other. For these reasons, the other Squeeze, in most cases, will be 3-5 bars too late compare to our Squeeze, which uses a completely different calculation for the histograms. It’s not based on the Momentum indicator, it is not based on the CCI indicator. Not only our Squeeze responds to price actions faster and more precise, it monitors the price closely, mimic the market movements and screens out the noises, often leads you to the very last candle before the price reverses. Some visitors who trade with the other Squeeze for years like to compare the two indicators. They often focus on which one fires up first. Needless to say, our Squeeze is the absolute winner. But what they have missed is, once you are in a trade, our Squeeze will help you manage the trade more precisely, and more importantly, lead you to the end of a trend and tells you when to get out. You can’t do this with the other Squeeze indicator due to the nature of Momentum indicator. Also, the divergence is one of the most important part of our trading system. Our Squeeze shows divergences much more accurate, while the other Squeeze is much worse in this department, again, due to its nature. We have many charts of comparison of the two Squeeze indicators on our website. Study them and you will see the obvious differences.
2. Middle Line: As mentioned above, the Bollinger Band/Keltner Channel is a fascinating idea in theory. But ask yourself what do you get when you put two lagging indicators together? Most likely when you enter a position with the other Squeeze, the PBF traders will be moving their stops to protect their profits already. This means much more potential, as your initial risk is always your entry point to the most recent swing high or low. The closer to the pivot point you get in, the less risk you are taking. I can not emphasize this enough.
Our middle line has abandoned the old idea and we have designed another indicator to replace it. The middle line is now more important than ever. It can be traded as an indicator all by itself, because it IS another indicator. We could sell this indicator separately, but we decided to place it in the Squeeze to save our screen real estate. Remember, we designed those indicators mainly for our own trading, not to sell them, so whatever serves our purpose. At times when the histogram and bias disagree, it’s better to wait until the bias approves the entry signal to enter a position. Most visitors also under-appreciate this line. Pay more attention to this middle line, you will see its importance just like us. Our Squeeze worked great before we had this line. Yet our win rate still improved a lot after we incorporated this line in the Squeeze indicator. It’s the heart and soul of the PBF_Squeeze! It is not a “go-no go” indicator any more! It allows you to enter a long position even if the histogram is below the 0 line and vice versa!
3. Counter Trend Mode: Our Squeeze has a Counter Trend mode built in. When it is set to true, it allows you to take counter trend trades with 2 safe setups, which are described in detail in our trading manual that comes with the indicator. It allows you to safely enter a position on the “wrong” side of the market and ride it back to the “right” side without having to wait for the Squeeze to “fire up” (this is a term that “the other Squeeze” uses, meaning waiting for the histogram to poke through the middle line from one side to the other). A few bars ahead of the crowd can make a huge difference over time. It allows you to be more consistent even if you make the same amount of trades over time. Once again, you will not be able to trade our rules with the other Squeeze due to its imprecise nature. Our Squeeze shows divergence much better and way more accurate. It often leads to the beginning of a reversal. That means when other traders are still waiting for “confirmation”, you are already a few points ahead of the crowd. You will see this type of setup throughout the trading day, and throughout the charts posted here. Study the charts, and you will see how simple yet powerful our indicator and trading system really are!
4. Trading Rules: If I understand correctly, the other Squeeze only has one entry rule, that is when its middle line turns from red to green (or blue), enter a trade in the direction of the histogram, and exit when the histogram turns dark green or dark red two bars in a row. There are a few problems with this: 1. Your entry points, as we have established above, will often be too late. 2. If the market moves all day long, you will not get red color in the middle line, then the entire setup is void, you could sit there frustrated, watching the market all day, but couldn’t find an entry signal, while the PBF traders are making consistent trades. 3. Most likely, it will be more difficult to manage your position once you are in the trade, you may often be getting out prematurely, and leave too much on the table. Our Squeeze indicator monitors the price actions closely, the histogram together with the bias line will give you many entry and re-entry signals throughout the trading session. It is not unusual that those signals and our trading system yield good result.
I have the ultimate respect for the trader who are selling the other Squeeze indicator, as I have read his book, seen him on CNBC and several other occasions. I like his honesty and his professionalism, which is hard to find in this business. But in terms of the indicators, charts simply don’t lie. I can write a million words to convince you, but if my charts don’t back me up, it’s all useless. And I am not going to waste your, or my time.
The 3 setups outlined in the manual that comes with the Squeeze indicator are extremely powerful and accurate. In conjunction with other indicators such as our color-coded EMAs, the PB_DIRECTION Paint Bar, it pinpoints the exact entry and exit points. It is the best indicator we have ever developed so far. I won’t make another trade without it.
(NOTE: November 2007: We no longer trade with the blue/red middle line shown on the first 3 charts below, as the new, upgraded Bias line works MUCH better!)
(NOTE: July 2009: For NinjaTrader version of the Squeeze indicator, the above said abandoned idea is NOT coded in the indicator. You will not be able to choose between 2 styles. We no longer use the other style, and it is not necessary to code it into the indicators, which will only create more “plots”, and any redundant code might slow down your computer and consume more RAM usage. So we decided to leave it out.)
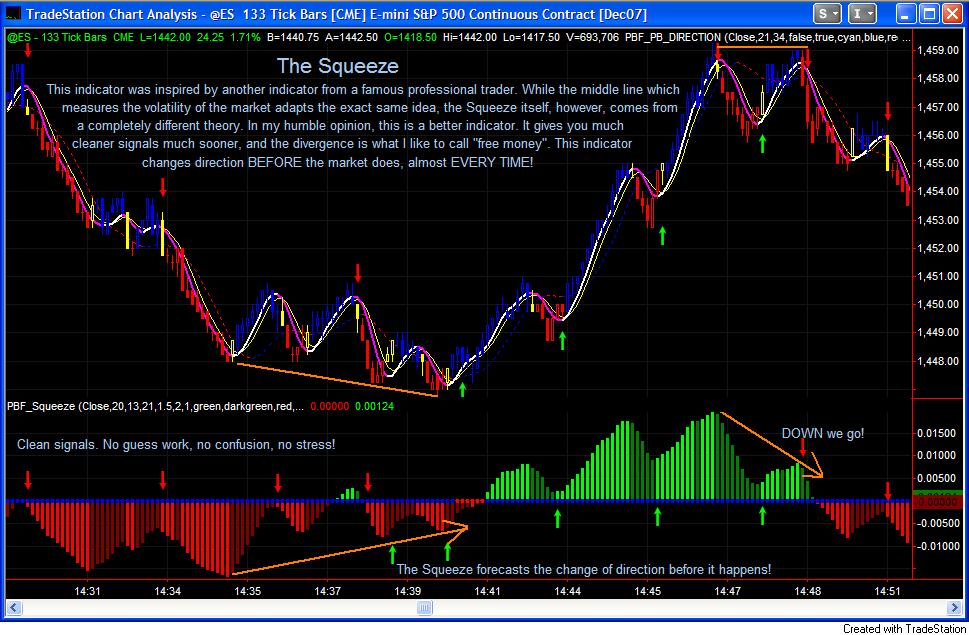
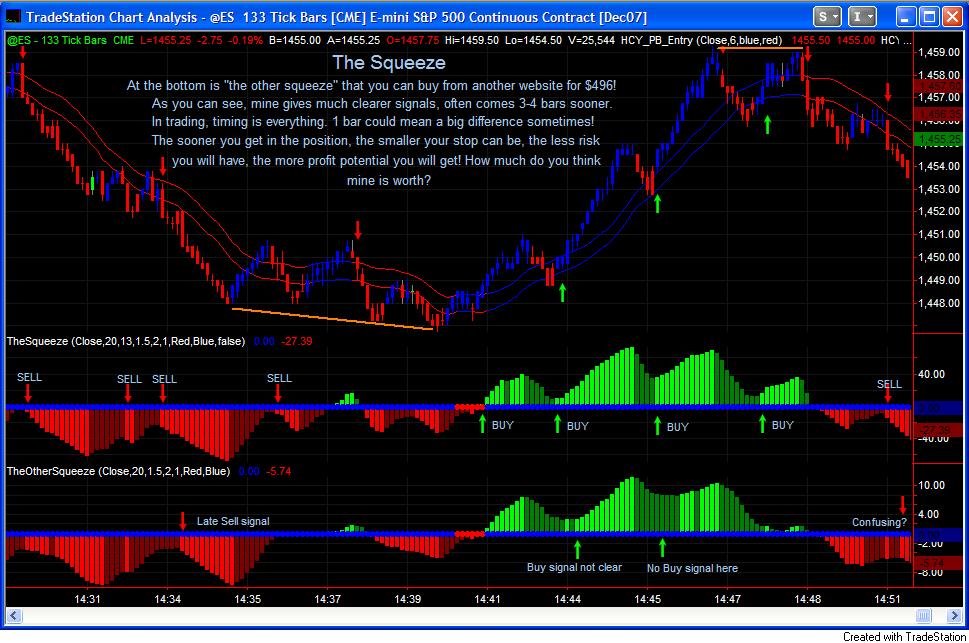
As you can see from the chart below, the PBF Squeeze gives more “clean cut” signals. Trading is all about timing, when to get in, when to get out, and in which direction. That’s all you need to know to be consistent. It can be stressful if the signal is confusing. My Squeeze often fires signals sooner and it responses to the price action much better. More comparison charts can be found by clicking “Trading System” tab above.
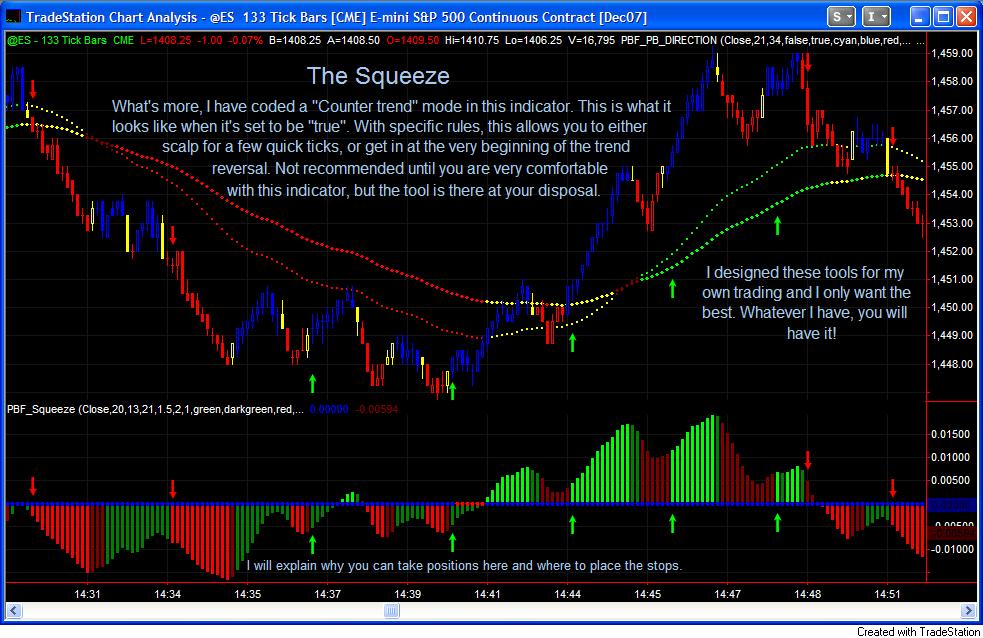
Every weekend we devote some time to do some research on how to make our already wonderful indicators more powerful if possible, or search the internet and see what others have to offer and what we can do to make my indicators better. It’s like an obsession! Or perhaps I should call it discipline! To twist the Squeeze even more, we have coded in a “counter trend” mode. With specific rules documented in the manual, it allows you to get in sooner, before the Squeeze fires, with nice visual aids. In fact, there are 3 setups to take signals from the Squeeze indicator. Wait for the Squeeze to fire is the very basic one (Level 1), and we only take it as a re-entry signal, which means the other two setups will most likely get you in before the histogram fires up!
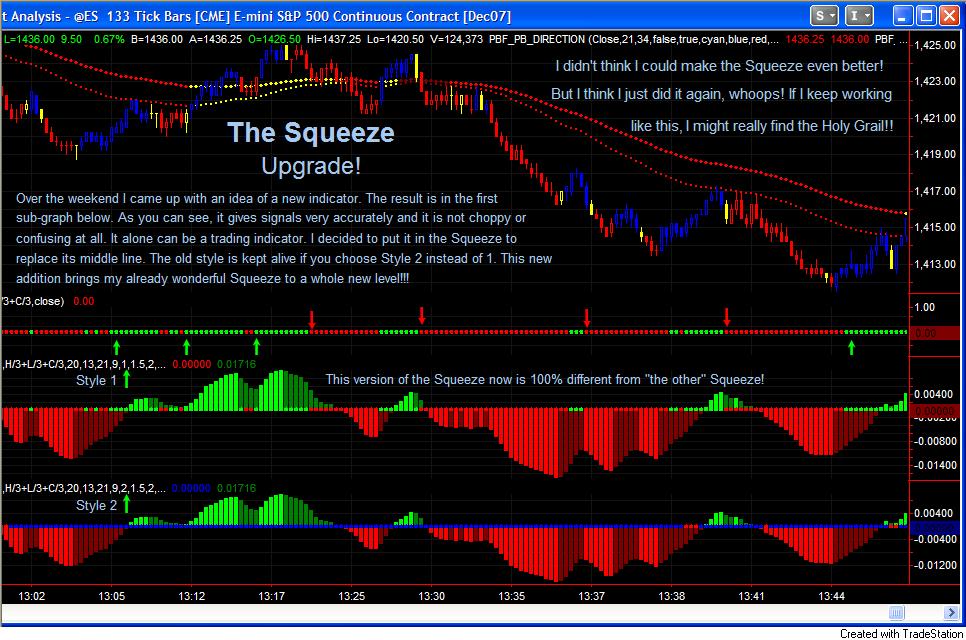
As if it is not good enough, we have decided to replace the middle line with a new indicator we came up with over a weekend! With the new Bias line which is another indicator by itself, the Squeeze is 100% original and has absolutely nothing to do with “the other Squeeze”. As you can see from the chart below, this new Bias line alone can be a traded with very good results. We thought about selling it separately, but decided to place it in the Squeeze to make it more powerful, save our charting space, and make the Squeeze “the” best trading indicator in the world!
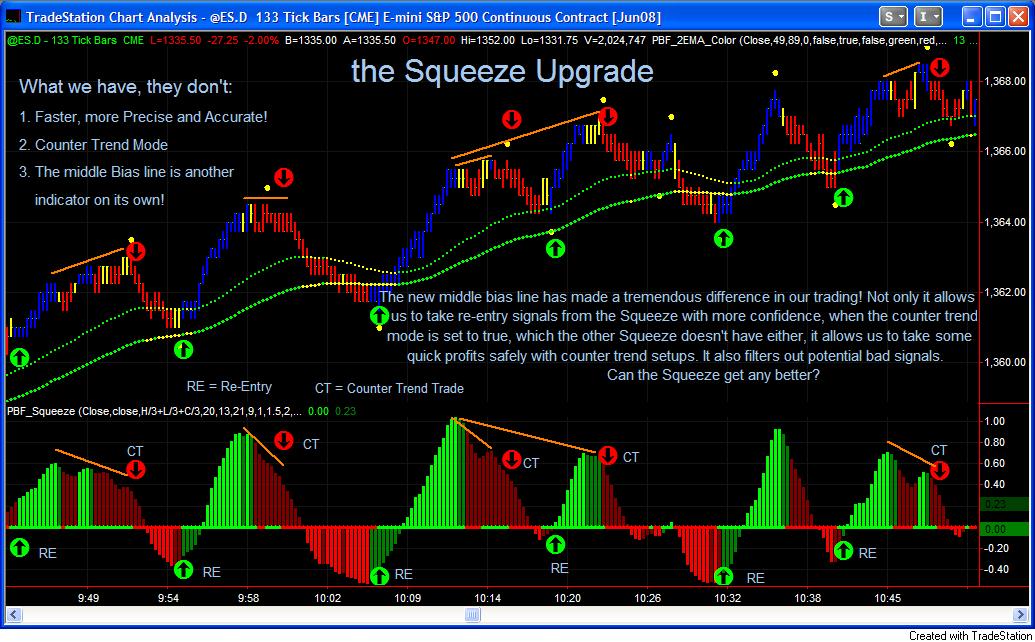
The new middle line has really made a tremendous difference for the Squeeze indicator and in our live trading! Not only it allows you to take re-entry signals from the Squeeze with more confidence, when the Counter-Trend Mode is turned on, with the confirmation of the new middle bias line, you can take counter trend trade as well, either grab some quick ticks, or as the chart shows below, in a none-trending market, which is usually more difficult to trade, the counter trend setups sometimes turn out to be the very beginning of reversals. The Squeeze indicator now is more powerful than ever!
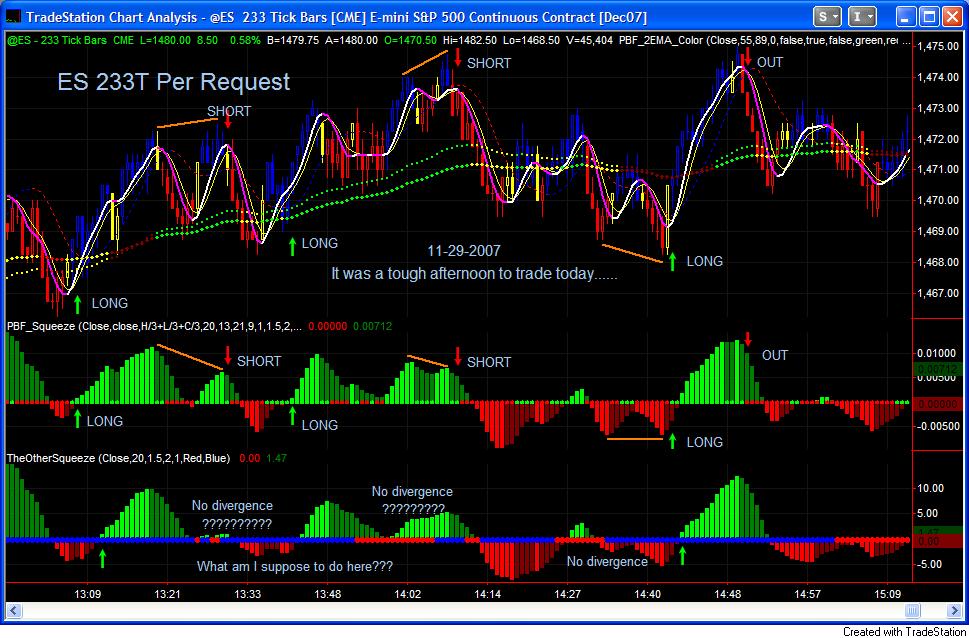
Here is another chart that shows the differences between the two Squeeze indicators. It was specifically requested by a veteran trader after a tough trading day, who owns the other Squeeze and many expensive trading indicators/systems. After viewing this chart of comparison for this difficult session, he immediately recognized the value of our Squeeze indicator, became a believer and bought a package from us. When we were preparing the chart, it even shocked us! What a huge difference! Our Squeeze indicator obviously shines even more in difficult market conditions. The divergence is an important part of our trading system, it’s the level 2 of our 3 trading rules.
In the two hours of trading shown on the chart, our Squeeze showed 3 divergence trade setups, each one would have brought in 2 to 4 ES points in profit, while the other Squeeze was doing nothing but “Di Di Di”. If it missed 3 winning setups in 2 hours, how many did it miss in a day, a week, a month, or a year? And what differences would that make to your bank account? In addition, the first long trade on the chart, it appears our Squeeze fired up 5 bars sooner than the other Squeeze. FIVE. How would you like to get in before the crowd and have others eat your dust? (If you love sports cars as much as we do…..) What differences would it make if you make an extra point per contract per trade, while making the same amount of trades over a period of time?
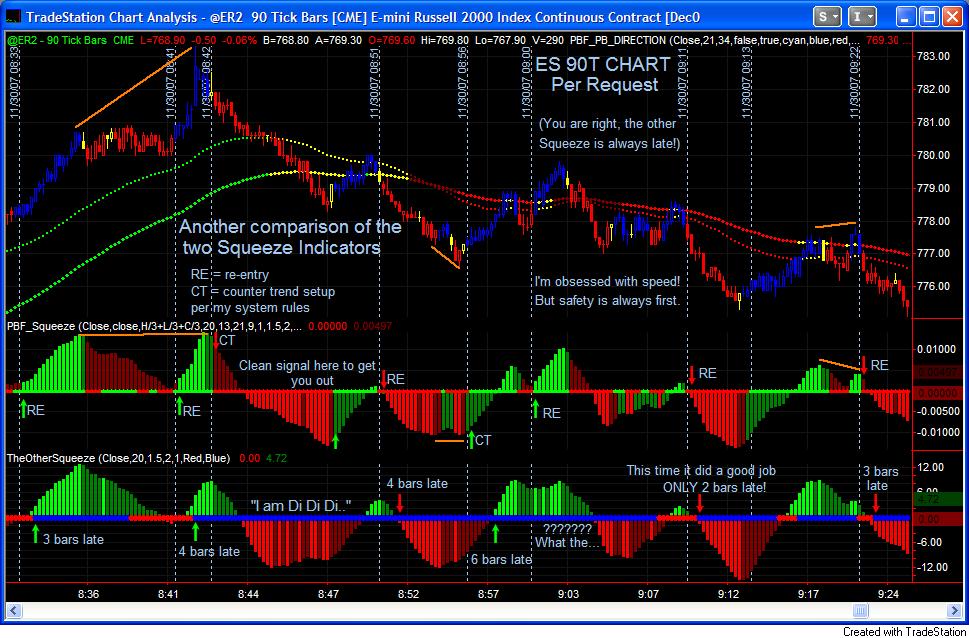
Yet another chart of comparison per customer’s request. This is an ER2 90-Tick chart. The vertical lines help you clearly see the differences between the 2 Squeeze indicators. Our Squeeze indicator always gives signals sooner, and the signals are always much clearer. Are you convinced yet?
Squeeze Radar Scanner ($347.00) For package and Squeeze indicator owners ONLY. It will NOT plot the Squeeze indicator on your chart, works ONLY on TradeStation Radar Screen and MultiCharts V5.0 official release platforms.
If you day trade only one or two symbols, you do not need this indicator. If you swing trade, position trade, or day trade watching multiple symbols, this indicator may be what you need. Instead of watching multiple monitors, now you can simply import all the symbols you trade into the Radar Screen, and let the Squeeze go to work for you. For swing and position traders, import as many symbols as you want, the Squeeze Radar Scanner will scan the market and come up with possible buy/sell candidates. You can sort the list and place the most recent signals on top of the screen. Works on tick and all time-based time frames.
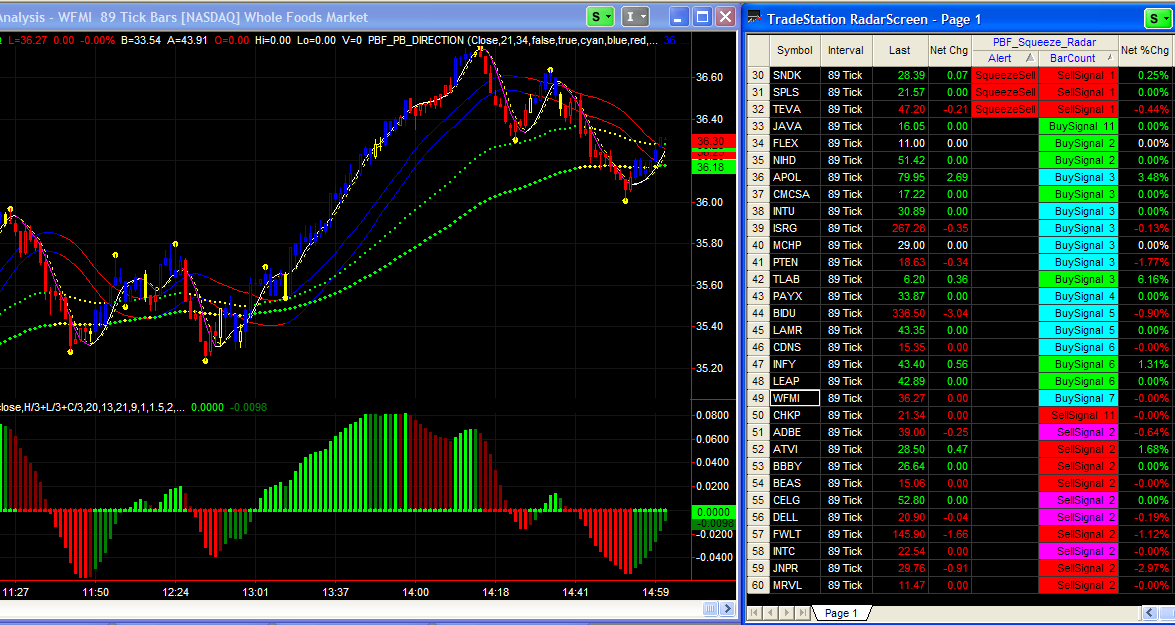
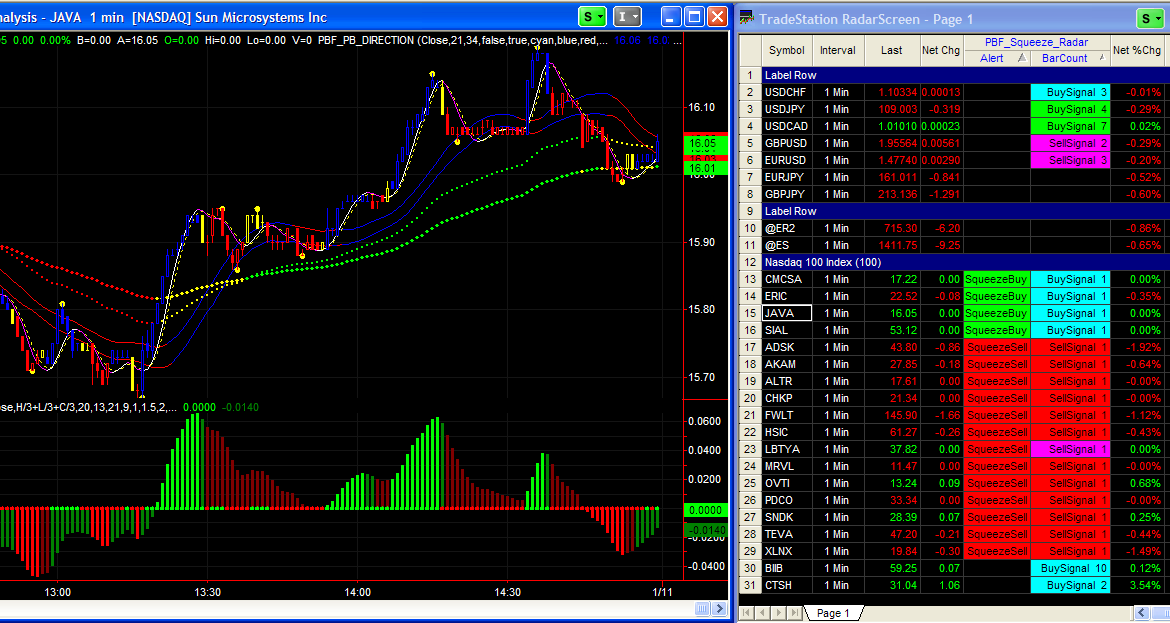
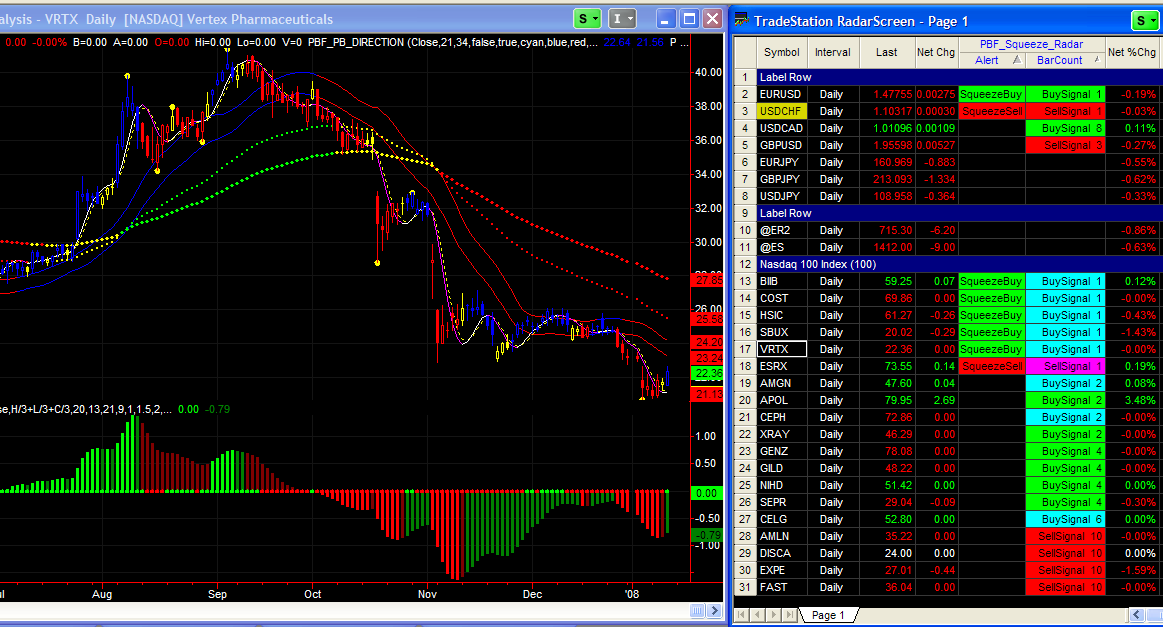
As you can see from the screen shots below (89-tick, 1-minute and daily charts), there are two columns under the PBF_Squeeze_Radar: Alert and BarCount. When a buy/sell signal per system rules is triggered, a “SqueezeBuy” or “SqueezeSell” alert will appear in the Alert Column to show you the most recent signals. When the market moves to the next bar, the Alert will disappear, but under the BarCount column, as long as the market continues to move in the direction of the alert, the cells will be filled with corresponding color, with Buy or Sell Signals followed by a number. This number indicates how many bars ago the alert has been triggered. On the first chart below, you can see the SNDK, SPLS and TEVA have Sell Alerts for the current bar. JAVA has a Buy Signal, but the signal was triggered 11 bars ago, indicating the price of this symbol has been moving up for a while, it may not be a good candidate to buy any more, FLEX has “BuySignal 2”, which may still be a good candidate for a Buy.
The color under the Alert column will be either green or red. Green for a buy and red for a sell. The colors for Sell Signals in BarCount cells will either be red or magenta, while green or cyan for Buy Signals. When you have green or red in this column, this means it is a trend trade setup, the alert is on the “right” side of the market. When you have cyan or magenta, it means it is a counter trend setup, you might want to exit your existing position when you see this, or to check if there is a divergence between price and the Squeeze to enter a counter trend trade.
In short, in the two columns of the Squeeze Radar Scanner, you may consider entering a position when you have green-green for long, or red-red for short, this setup is with the trend. If you have green-cyan or red-magenta, check the chart for divergence, if there is no divergence between price and Squeeze indicator’s histogram, skip the trade, or consider exiting partial position if you already have one.
If you own the PBF indicator package, when you link a Radar Screen to a chart, you can simply click on the symbols on the Radar Screen, the chart will automatically appear as shown on the charts below. This provides speed for intraday trading, and conveniences if you swing trade.
2EMA Color ($197.00, receive the Fast3MA’s and modified RSI for FREE, Plus a separate Trading Manual)
As a general rule, when the EMAs are green, take only long positions. If they are red, only go short. When they are dark red with an angle, it warns you the trend is about to change and the market is like to be moving towards the other direction. When they are dark red and without much of an angle, the market is flat, there is no clear trend and you should stay away. The color yellow, as in all my other indicators, has multiple meanings. It, A. indicates areas of congestion, B. gives early warning of the trend reversal as shown in this picture, and C. when the market is in a strong trend, if the price pulls back enough, it will turn yellow to warn you and you could consider entering a position in the direction of the trend. You can see more pictures by going to “More Examples”. Note the criteria for the color change is not just measuring the distance between the 2 EMAs, or “if the EMA is higher than itself 1 bar ago, turn green” as you can tell from the chart. It takes other conditions into consideration and interpret the market pretty well. Note there are 3 options to choose from when you plot this indicator on your chart: Stocks, Futures and Forex. Default settings are different for the 3 markets. So remember to set one of the markets to be “true” and the other two to be “false” according to the market you are trading.
The information in the Manual that comes with the moving averages is worth the price by itself!
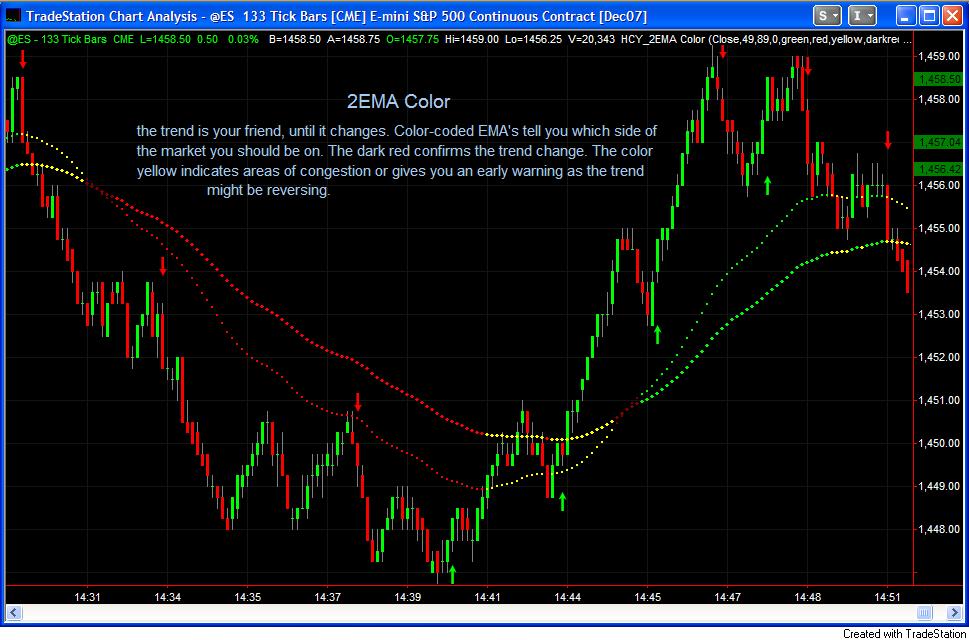
* The above is a screen shot from NinjaTrader platform showing the 2EMA Color and Fast3MA’s.
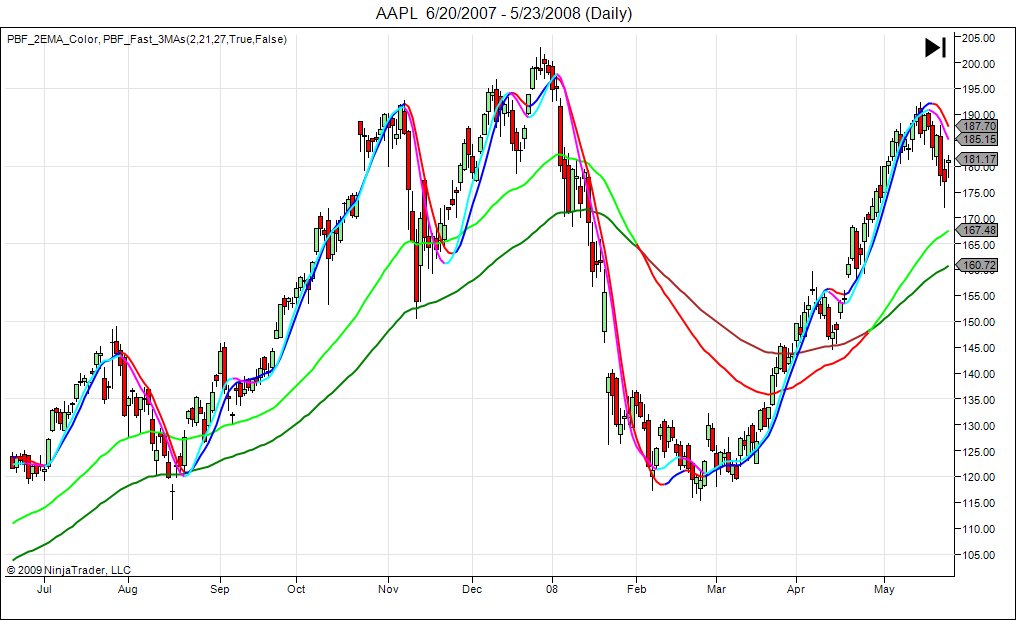
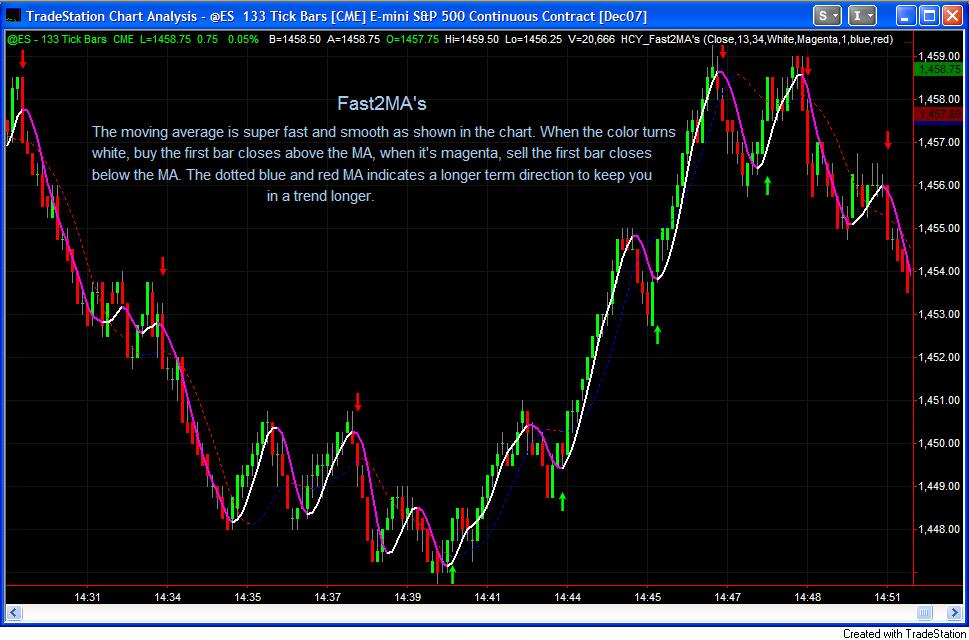
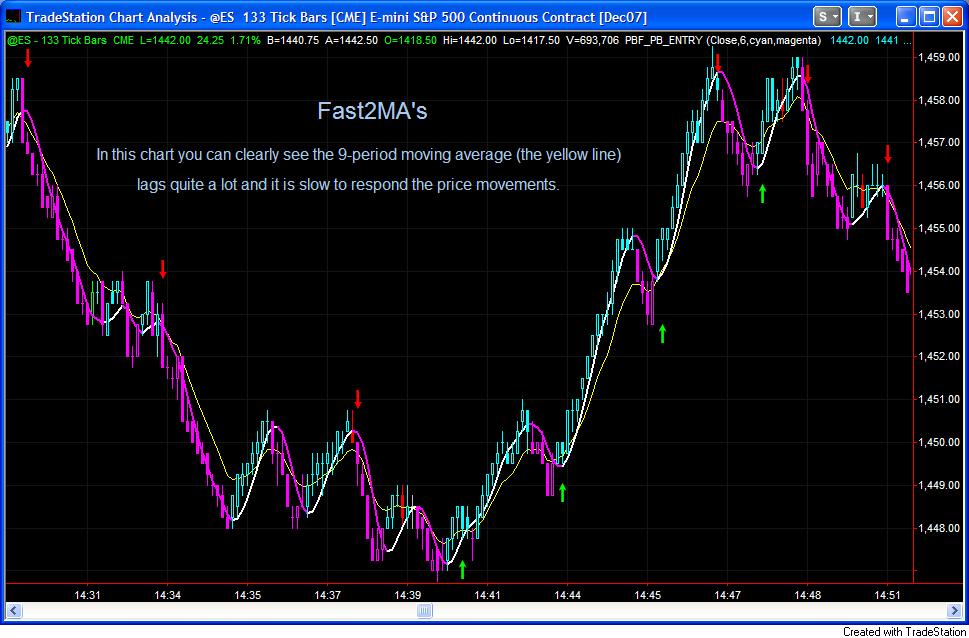
Fast3MA’s ($Free with the purchase of the 2EMA Color)
The regular moving averages don’t work well because they lag too much. This Fast MA works very well following the price, fast to response, yet still very smooth. I have found if you enter the positions in the direction of the trend, at the first bar when the price closes above the Fast MA for long, and below it for short, you would already be ahead of everyone else.
From the chart below you can clearly see the 9-period Exponential moving average lags quite a bit and it looks choppy. VERY difficult to trade with it. The Fast MA responds faster, shows precise turning point, and it is color-coded like everything else you see on this website. Our goal is to reduce the stress of trading by just looking at colors to enter or exit trades.
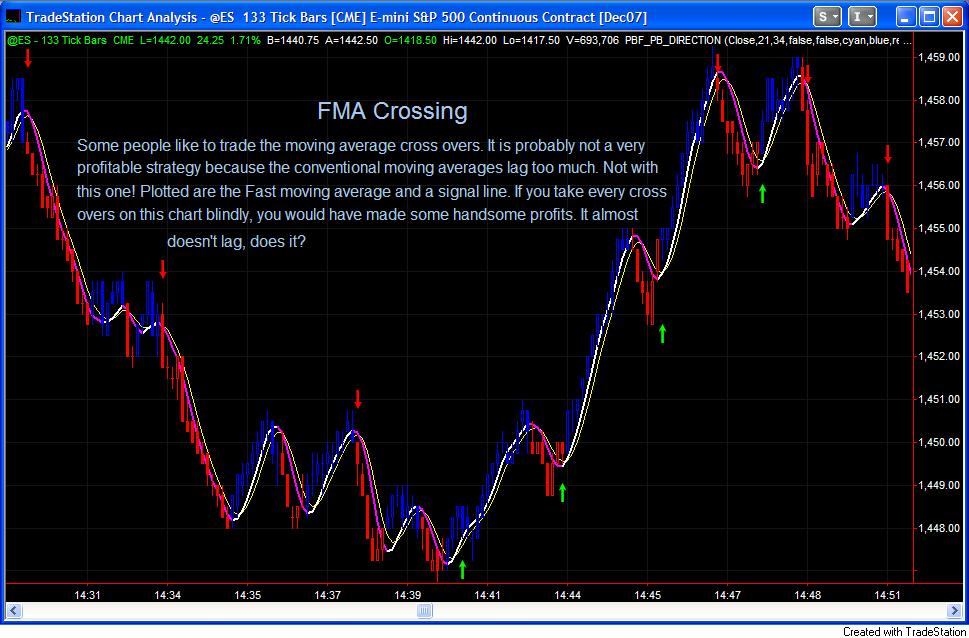
FMA Crossing
While it is a vital strategy to trade the moving averages crossovers, it often fails. The reason is the regular moving averages lag too much, you will always enter and exit a trade too late because of the nature of the indicator. With the Fast MA, it will allow you to enter and exit trades much faster as it reacts to the market condition much sooner. The signal line shown in the chart below is not just another Fast moving average. It almost always turns within 1 bar when the Fast MA turns, but not choppy at all so there won’t be false signals.
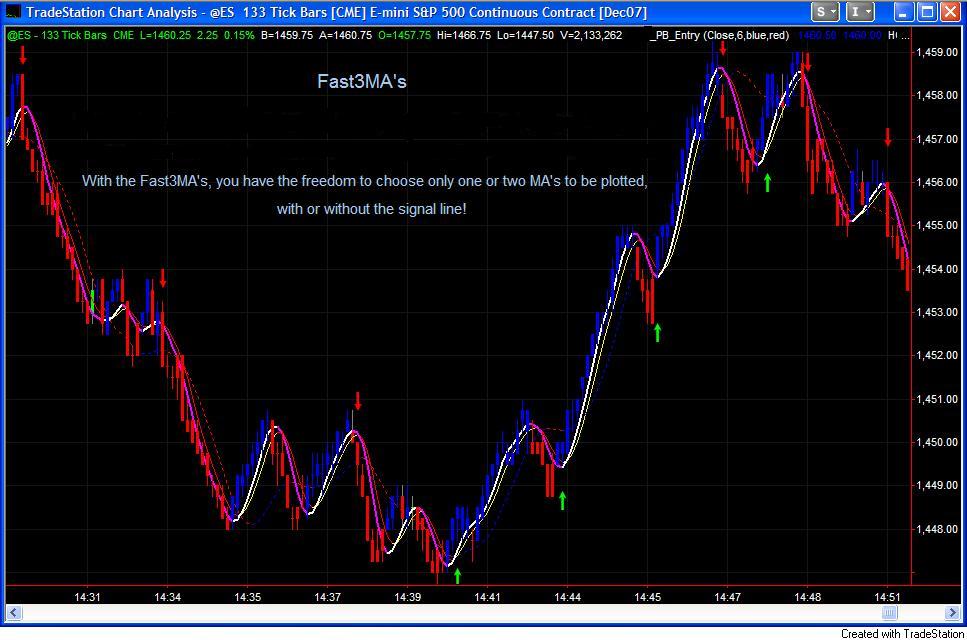
With the Fast3MA’s, you have the freedom to choose which one or both MA’s to be plotted on the chart, with or without the Signal line. Whichever way suits your trading style, whether you are a scalper who likes to take the middle part and play safe, in and out of the markets more often, or a swing trader who likes to ride the trend longer.
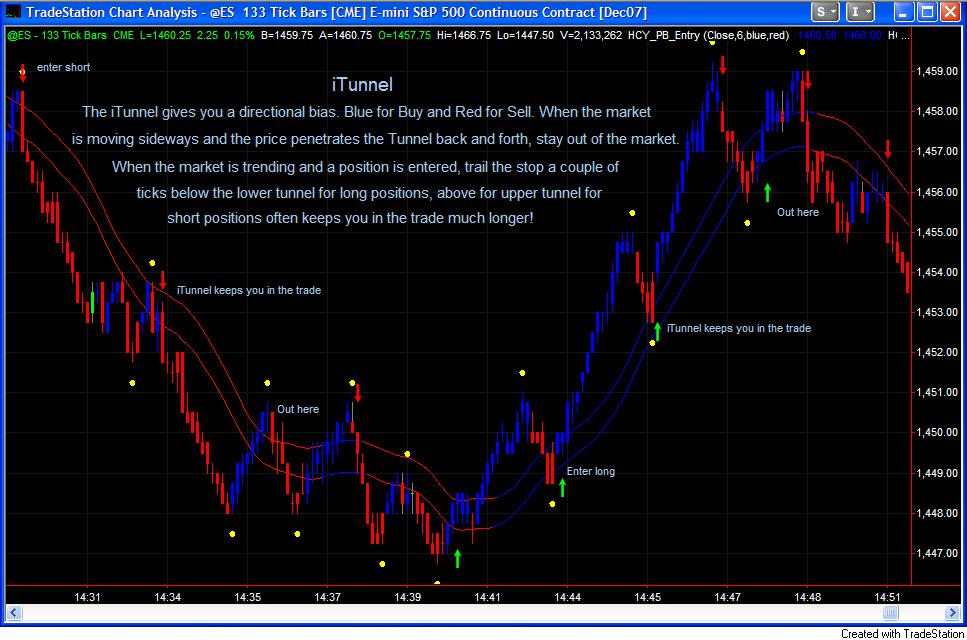
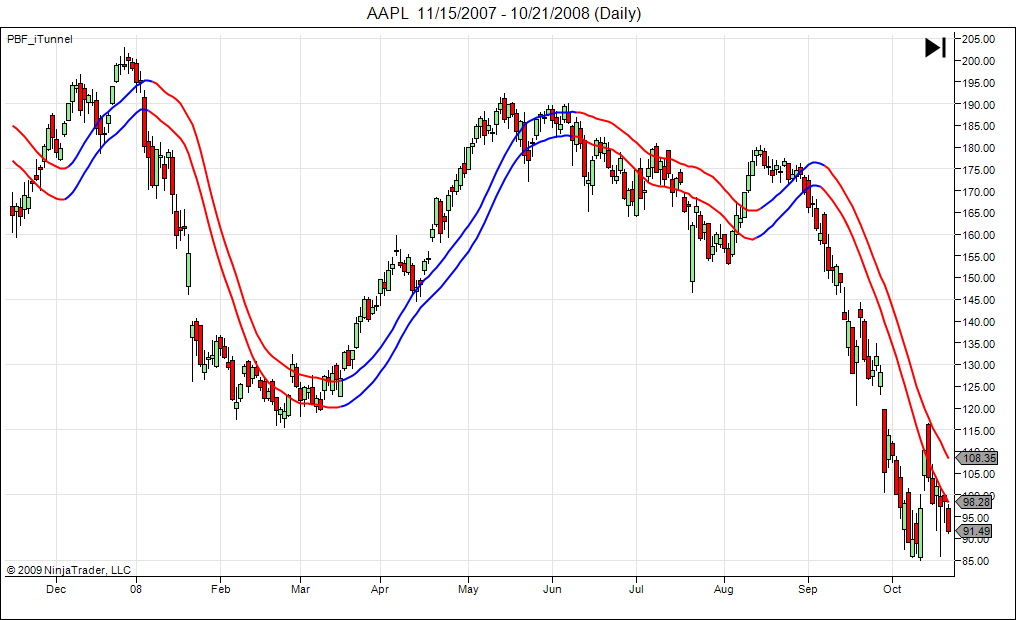
iTunnel ($197.00, compare with $395/month one company is leasing, and you get the HeatMeter and modified DMI/ADX Combo FREE)
This indicator and the HeatMeter below are similar to part of the indicator package one company is leasing for $395.00 a month plus $100 one-time setup fee (as of the writing of this description). They use them as part of their 100% mechanical system. I use it differently. When the iTunnel is flat and moves sideways, the color changes back and forth between blue and red every few bars, the price penetrates the iTunnel up and down, there is no trend. Either stay out, or execute “hit and run” type of trades. When the iTunnel is blue and going up, or red and going down with a good angle, the market is trending. Enter a position near the lower band for long positions, or a short position near the upper band, and trail the stop just slightly below or above the band on the other side often yield good results as shown in the chart below, it measure the market’s volatility and keeps you in the trade longer and filters out the noises. Very good tool for this purpose!
(The yellow dots shown on the chart are the Scalper Dots which are not included in the purchase of the iTunnel. To learn more about the Scalper Dots, please visit the Show Me page).
Here is a screen shot of the iTunnel from NinjaTrader Platform.
PBF_OSOB ($247.00, get the modified CCI for FREE)
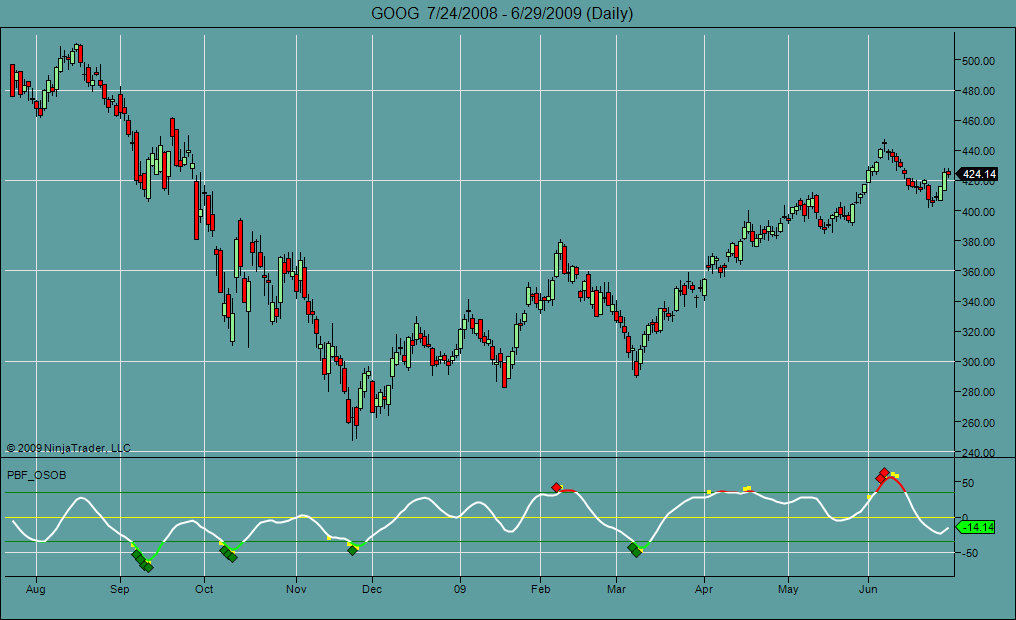
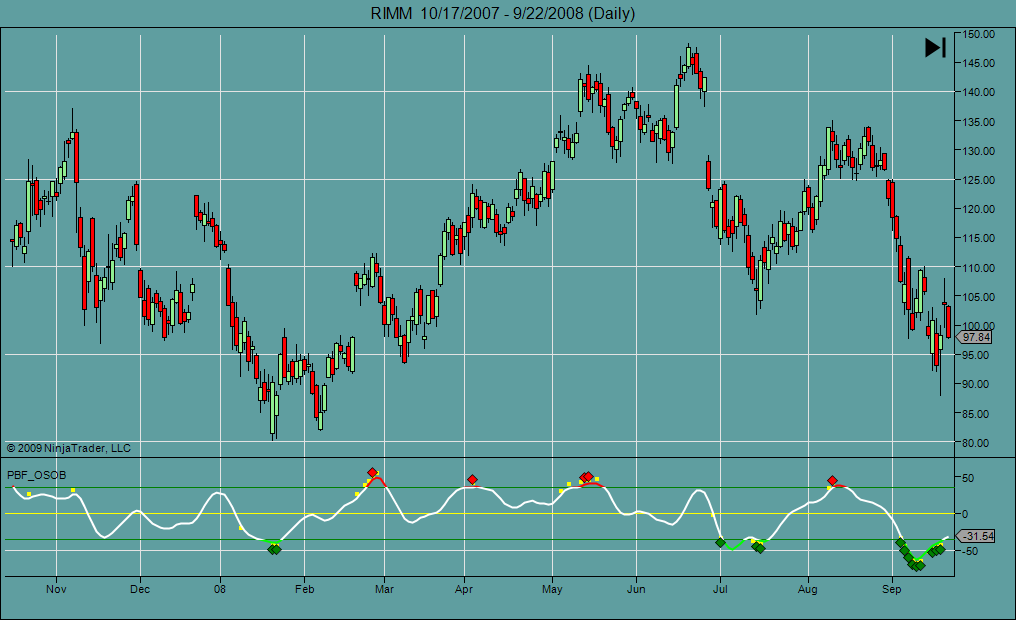
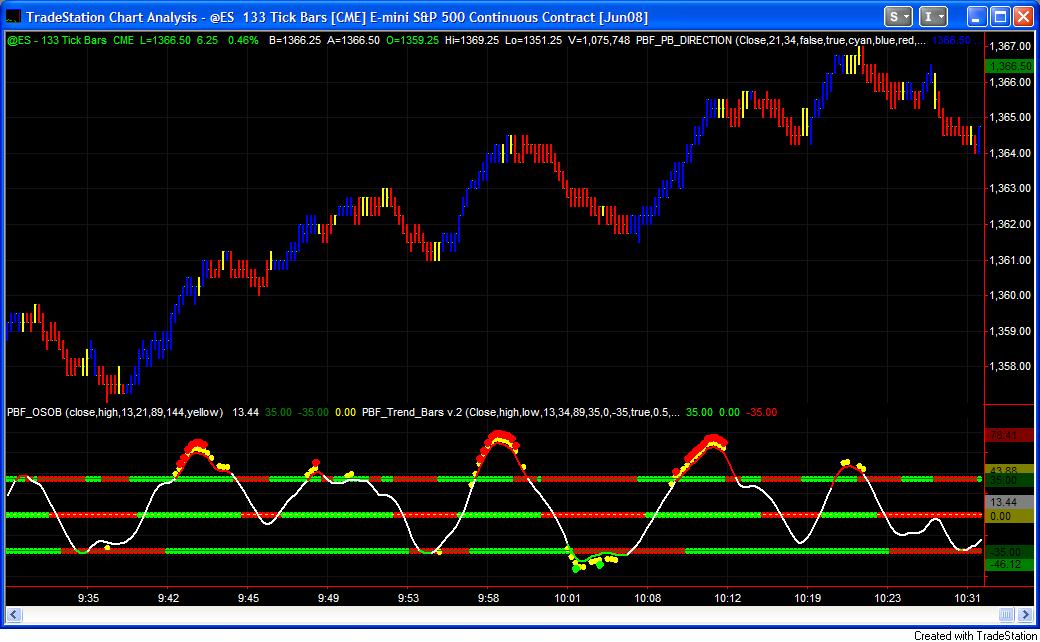
Quite honestly, I am not a firm believer of many things in trading, an Over Bought/Over Sold indicator is one of them. Every one knows picking tops and bottoms are dangerous, and I believe the market can remain over bought or over sold condition long enough to stop you out a few times before it actually reverses. This PBF_OSOB indicator, however, has changed my mind. There are 3 levels of warnings in this indicator. The white line gives you a sense of market direction. The yellow dots warn you for an over bought/over sold condition. When the red and green dots appear, the market is under extremely over bought or over sold condition. See charts below. Note the dots appear before the market turns, give you a early sign! They can appear even when the white line is not in the over bought or over sold zones.
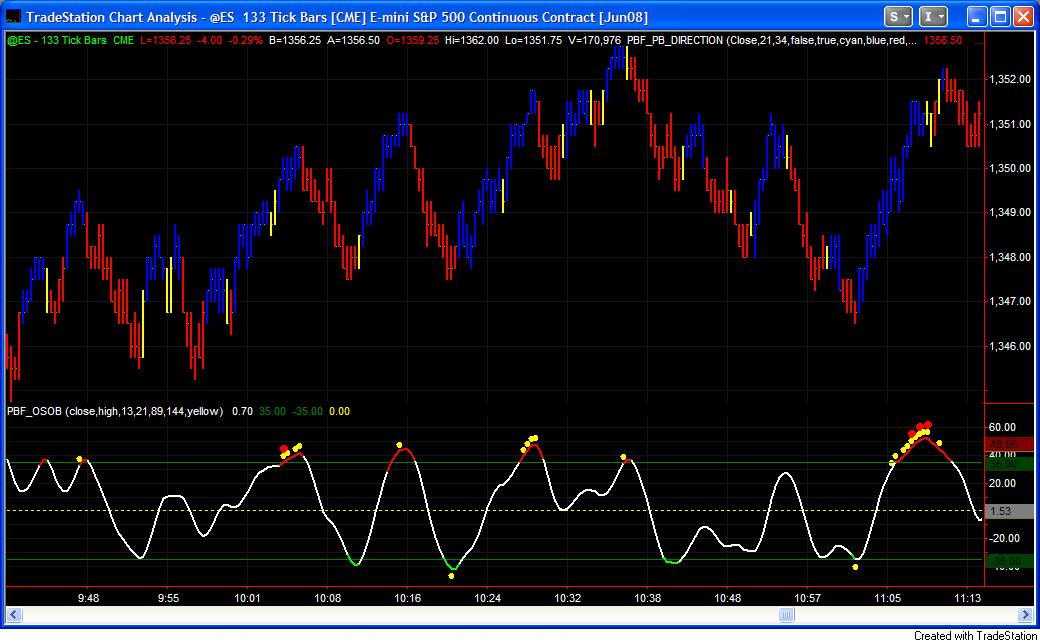
When the dots appear, the market is likely to slow down, go sideways, or reverse. If you are not a firm believer of over sold/over bought indicators, at least this indicator is excellent in showing you places to take part of your position off, scale in and out, or close your trade. Good indication for first target! Combine with the PBF_Trend_Bars, they form an excellent team to trade the markets! See bottom of this page to see how the combination of these two indicators work together.
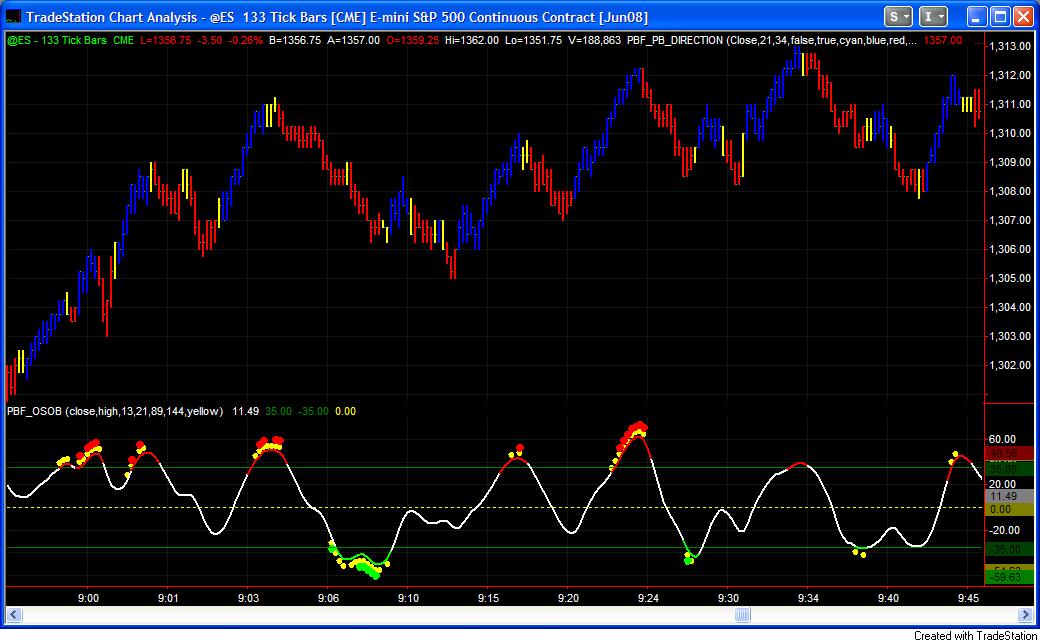
Look how accurate the OSOB is in range bound market condition!! It picks the tops and bottoms! In fact, if you go back to the Home Page and you will see one of the live trading examples was based on it.
Below are a couple of screen shots of the OSOB indicator on NinjaTrader platform.
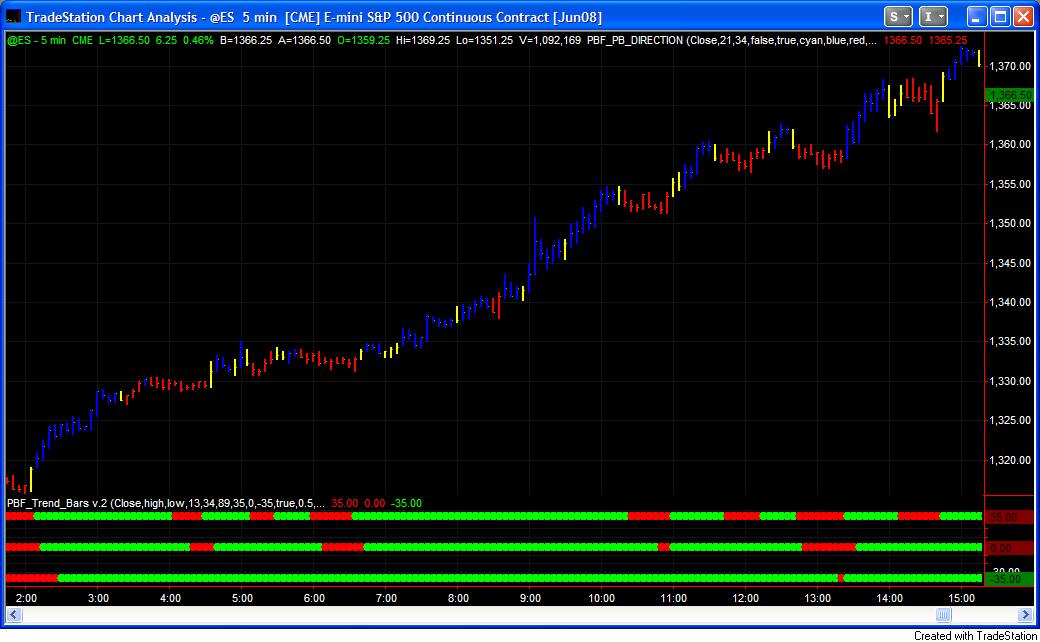
PBF_Trend_Bars ($227.00, get modified Momentum indicator for FREE)
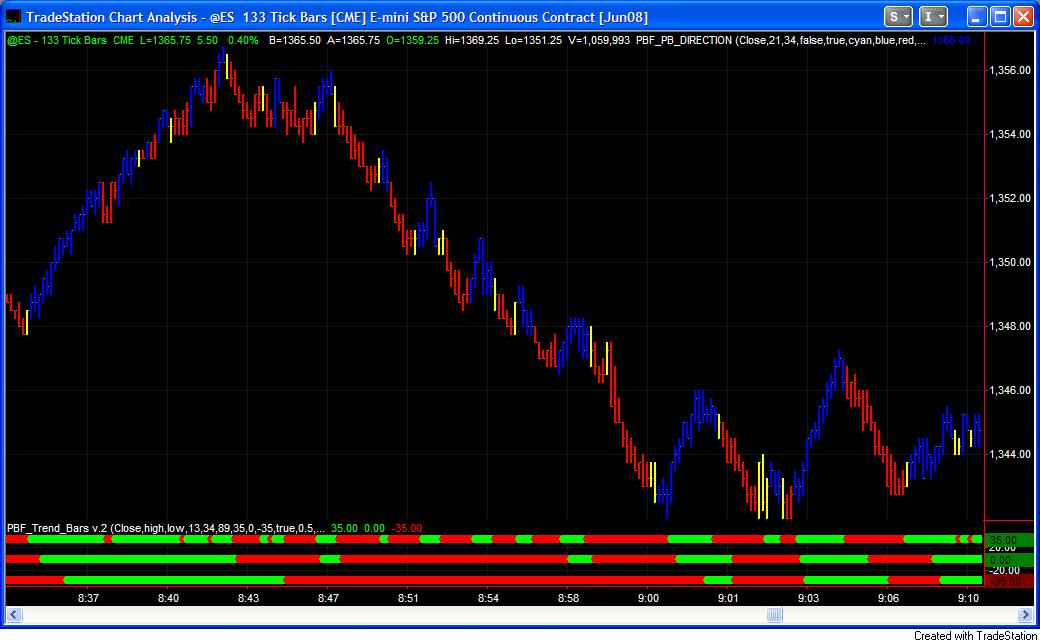
Every one knows the trend is our friend, go with the trend is always safer and often more consistent. The PBF_Trend_Bars plots 1 to 3 horizontal lines, showing short term, midterm and long term trend. When a trend develops, always take signals from a shorter term indicator in the direction of a longer term direction. See the chart below. The long term trend only had one red dot all day long! Incredible! When the short term trend turns from red to green, go long in the direction of the long term trend.
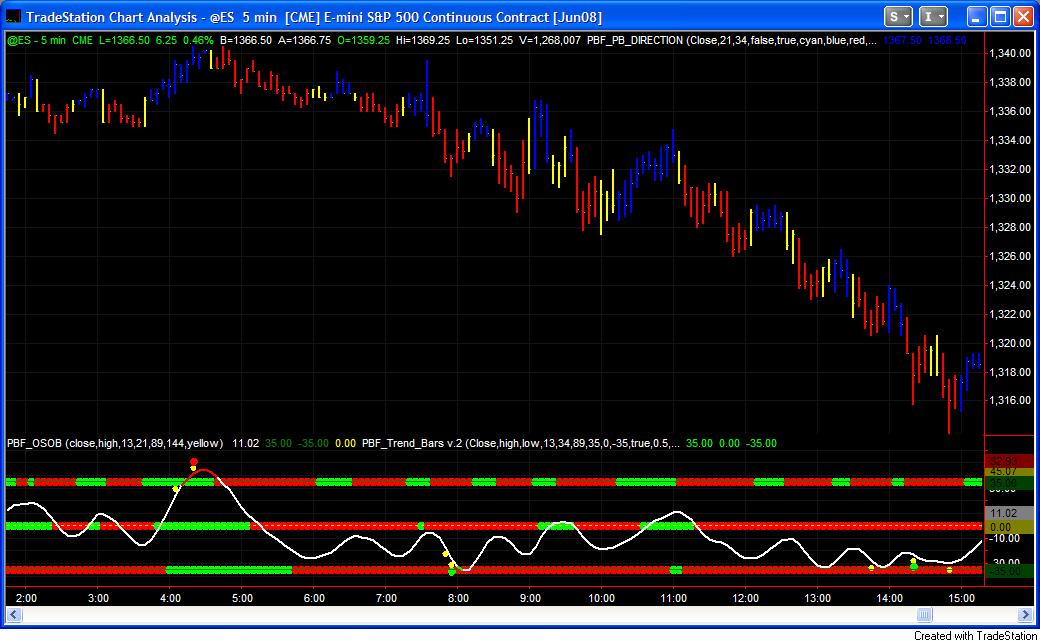
Here is a chart of a down day with OSOB indicator plotted as well. You can see more examples of this at the bottom of this page. When the OBOS stays between the bottom two Trend Bars, it is bearish.
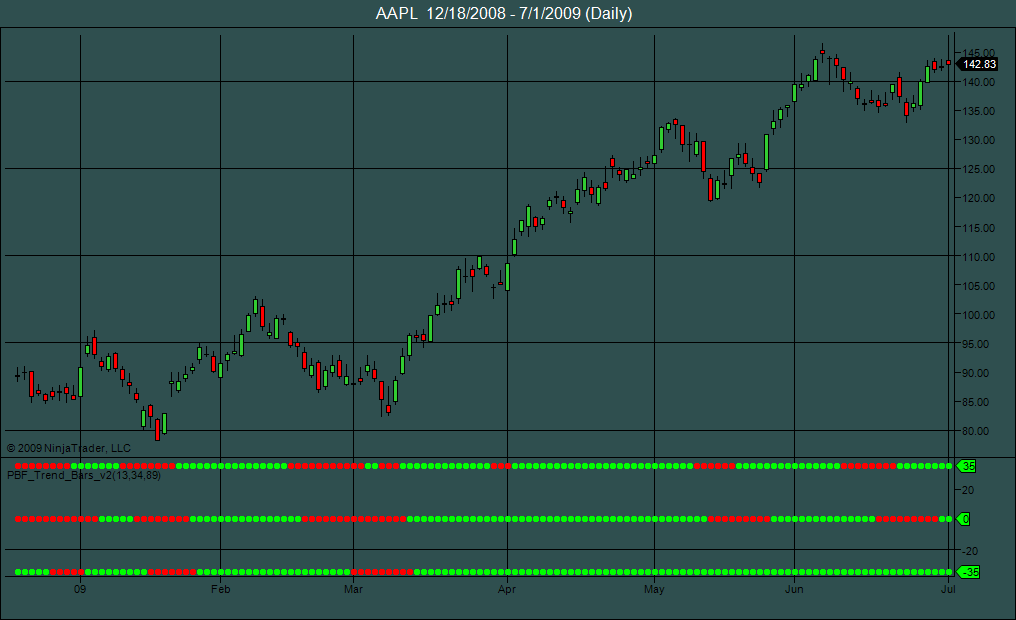
This chart shows some uptrend, down trend and range bound. You can choose to plot just1, 2, or all 3 lines, in any place you desire. For example, if you use Stochastic, you may plot these 3 lines in any order on 80, 50, 20 lines. But since you are reading this page, I guess you will never use Stochastic again!
A screen shot of the Trend Bars on NinjaTrader platform.
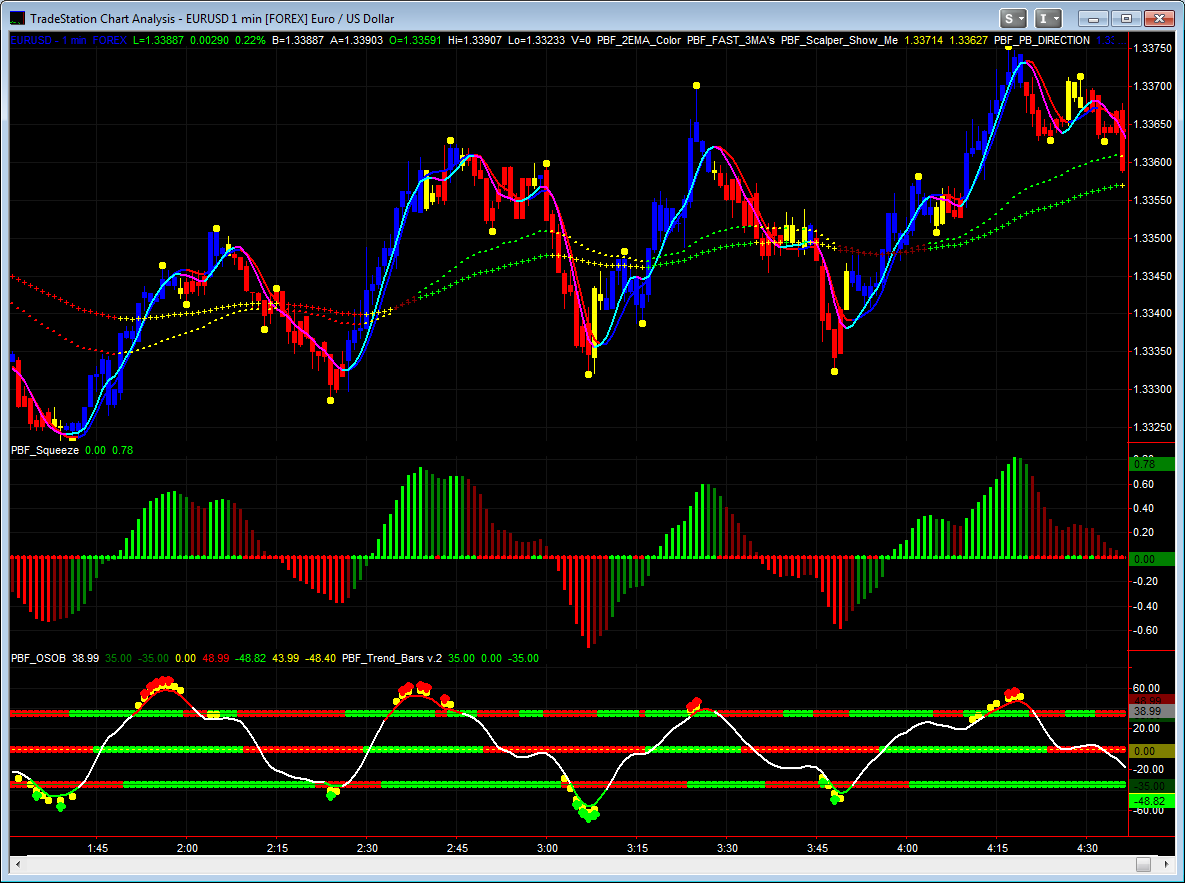
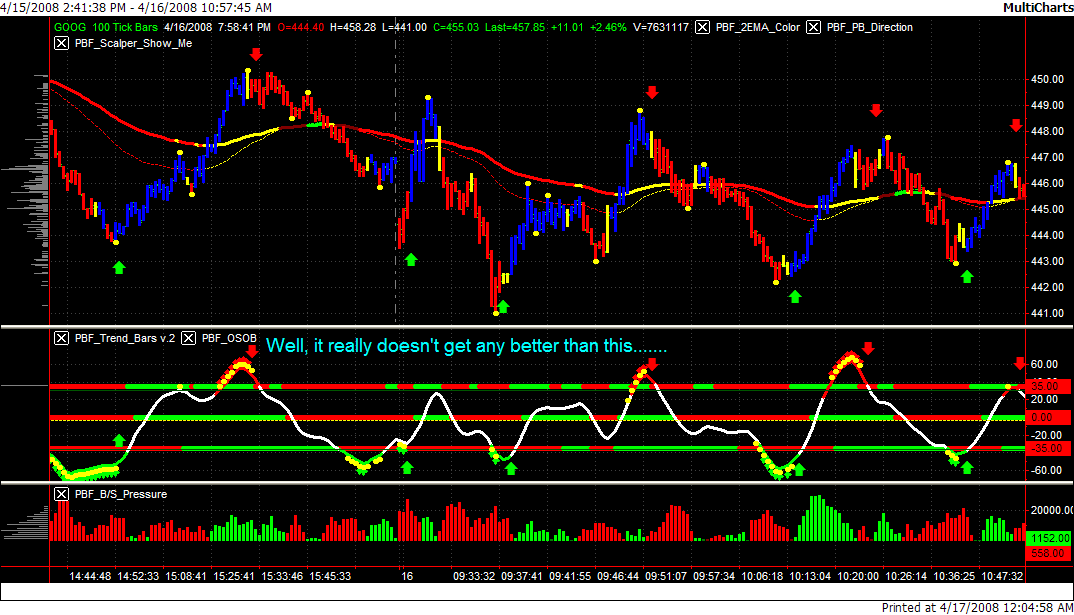
Combination of PBF_OSOB and PBF_Trend_Bars.
Now you have the best of both worlds! Each indicator by itself serves its duty well. The OSOB indicator is good to identify potential slow down or reversals, best when the market is bouncing around forming big waves. The Trend_Bars works best in trending market condition and keeps you in a winning position longer. Put them together, the picture is rather interesting. Suddenly we have discovered a world that’s good for both market conditions! The Trend_Bars indicator is designed to plot the 3 lines in any position you want. In this case it smartly lies in the middle, over bought and over sold lines.
Look at the example below! The OSOB indicator is excellent in catching turns in the market.
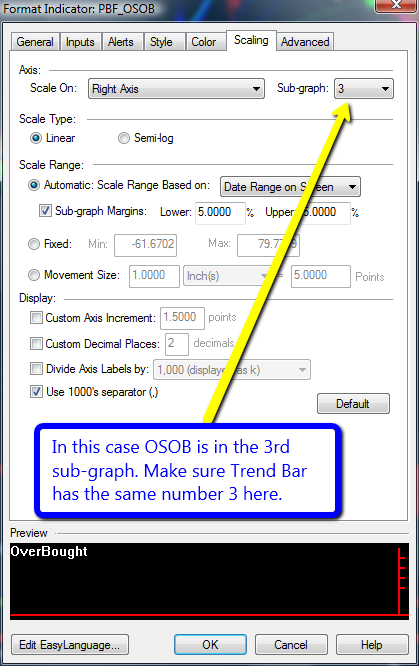
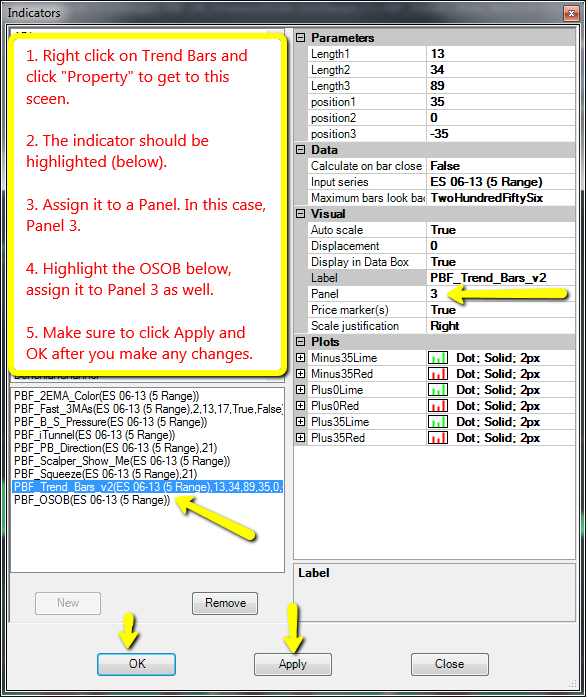
The screen shot below shows you how to overlay one indicator on top of the other in TradeStation. In this particular example, place the OSOB indicator on top of the Trent Bars in the same sub-graph. Simply go to the Scaling tab and make sure both indicators are assigned in the same sub-graph (in this case, sub-graph 3) and they will be overlapping. For NinjaTrader and MultiCharts, it is similar. Note that on TradeStation, whichever indicator you plot on your chart first will be on top, so if you want OSOB to be on top of the Trend Bars and not the other way around, make sure you plot OSOB on your chart before the Trend Bars.
For other free indicators such as HeatMeter, Buy/Sell Pressure, modified CCI, RSI, Momentum,DMI_ADX Combo, see “Bonus Indicators” page.