They say a good indicator is worth thousands of dollars! I mean, a picture is worth a thousand words! Let’s look at some more examples on how well these indicators work together as a system!
There are 3 setups….
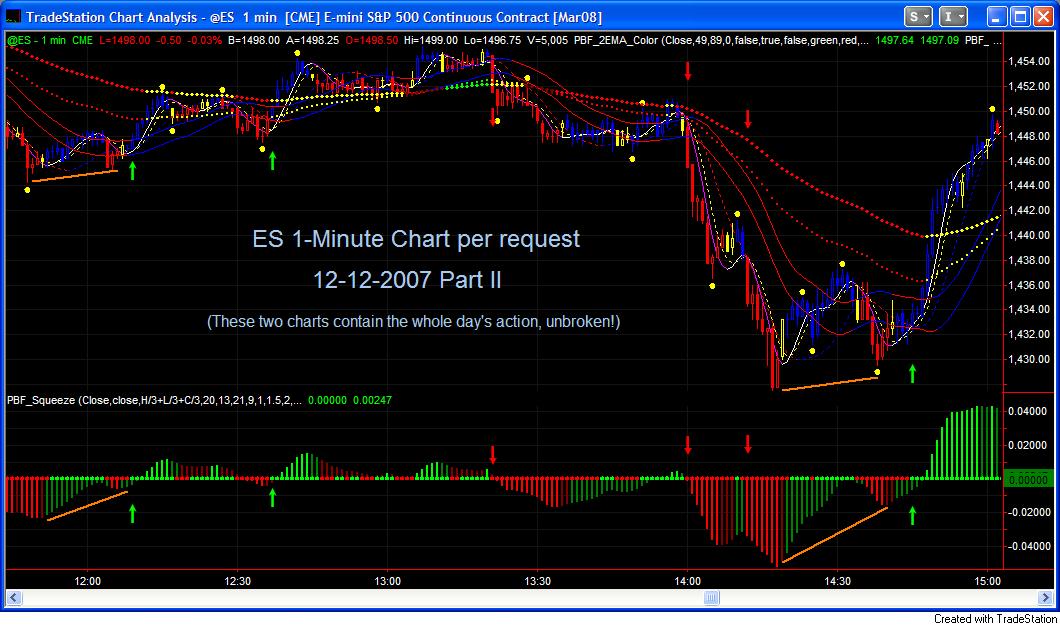
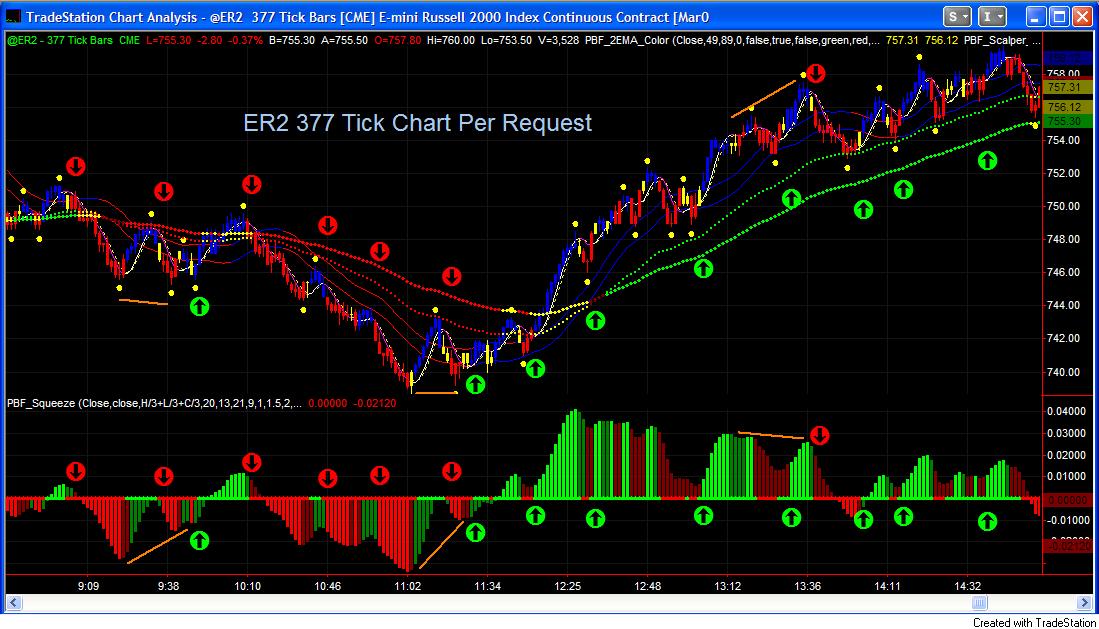
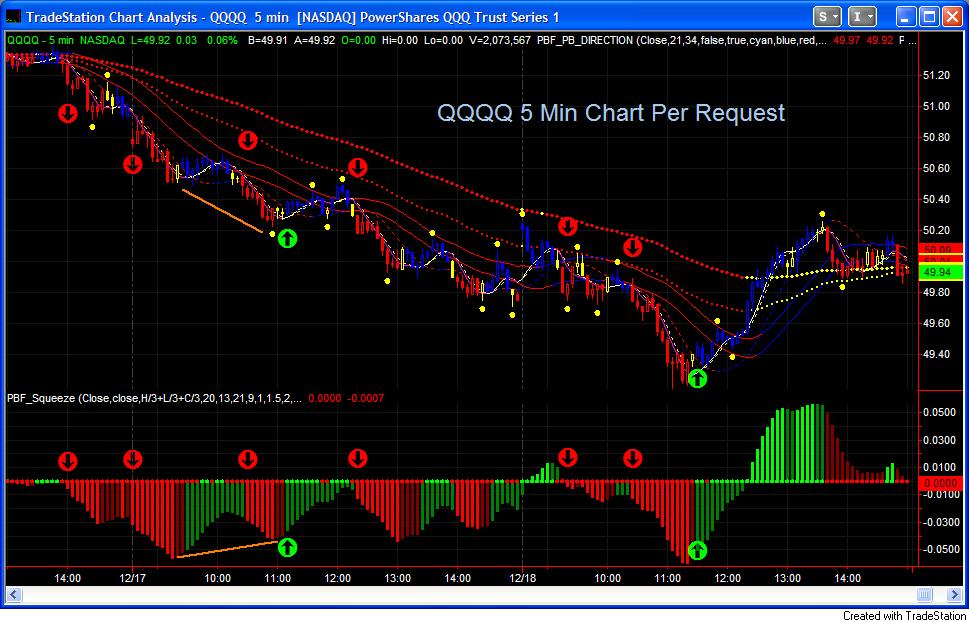
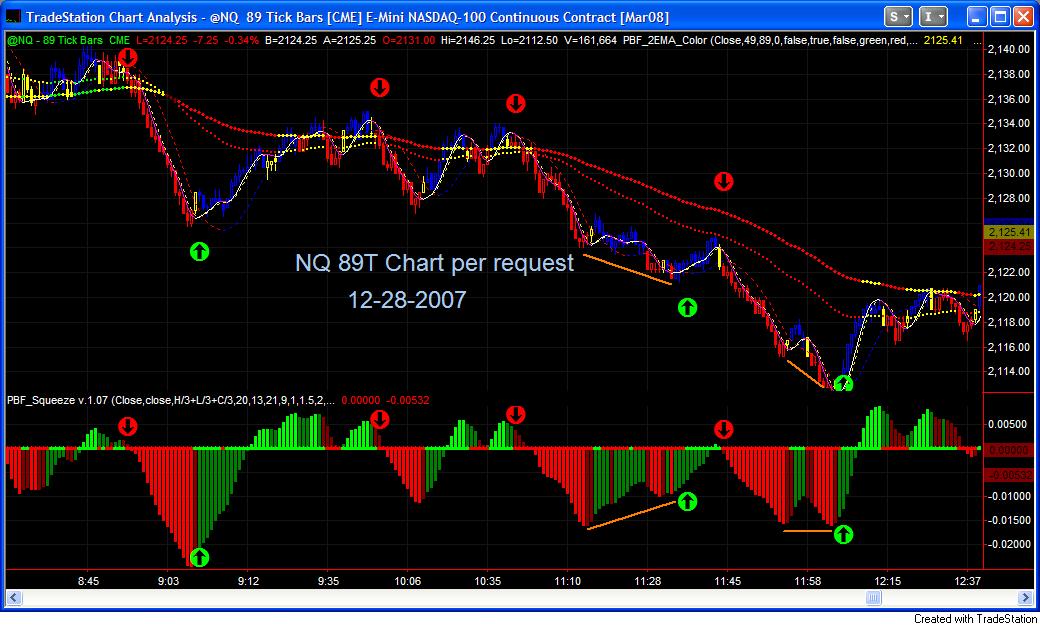
Unlike other developers who write thousands of beautiful words in their sales letters on their websites, but don’t show you more than 2 charts and you hardly even know what the indicators they sell look like, we have nothing to hide. We have more than enough charts on different markets and time frames for your review. If you think I cherry pick charts, you are welcome to request any symbol, time frame, even specific time and date, and I will post the charts here. Examine the charts below and see how the indicators work together. Some of them were requested by visitors from quite ugly trading sessions.
But we offer more than just indicators. As mentioned, we have a very consistent trading system first, then we custom designed the best tools for that trading system. The result is unlike anything you have ever seen. We don’t just throw random indicators out there, when one has little or nothing to do with another, or even giving conflict signals. The 3 setups occur every day the markets open, over and over and over…… This is the closest to the Holy Grail you can find, or we can find, unless we come up with something better. We don’t mess up our charts with useless lines and dots that only confuse you and give false signals. Every signal is clean and clear. It pinpoints the markets’ turning points in advance, allows you to get in at the beginning of the trend before the crowd, while safely guide you through the entire ride. We know every vendor says the same thing. They may have won some award from TradeStation or what not, we are not interested in that. We designed the indicators for our own trading, the indicator business is a complete accident. And we are the only one who lays everything out here for your review so you can make educated decision before investing your money.
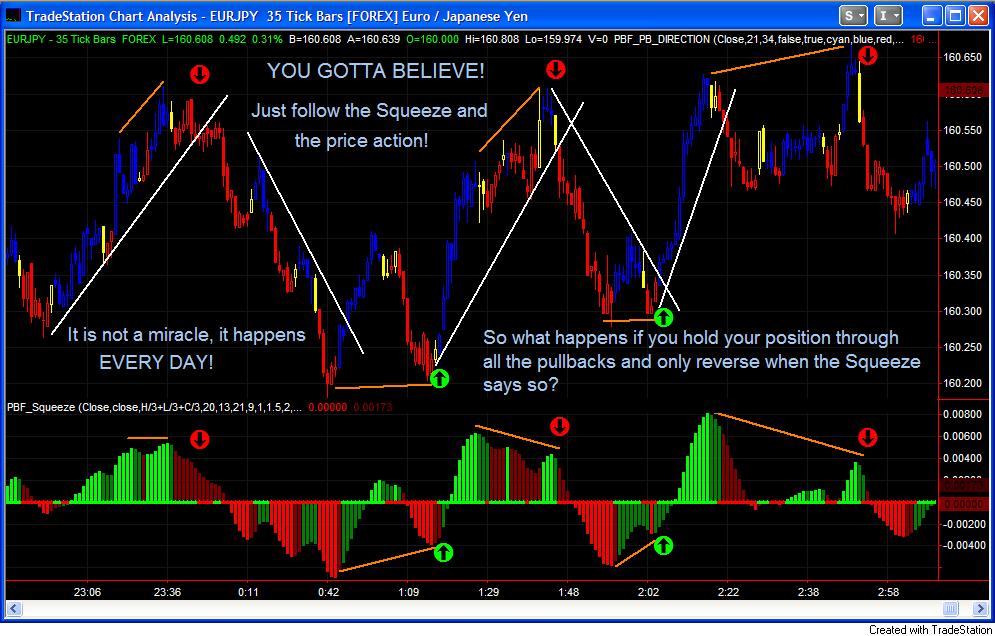
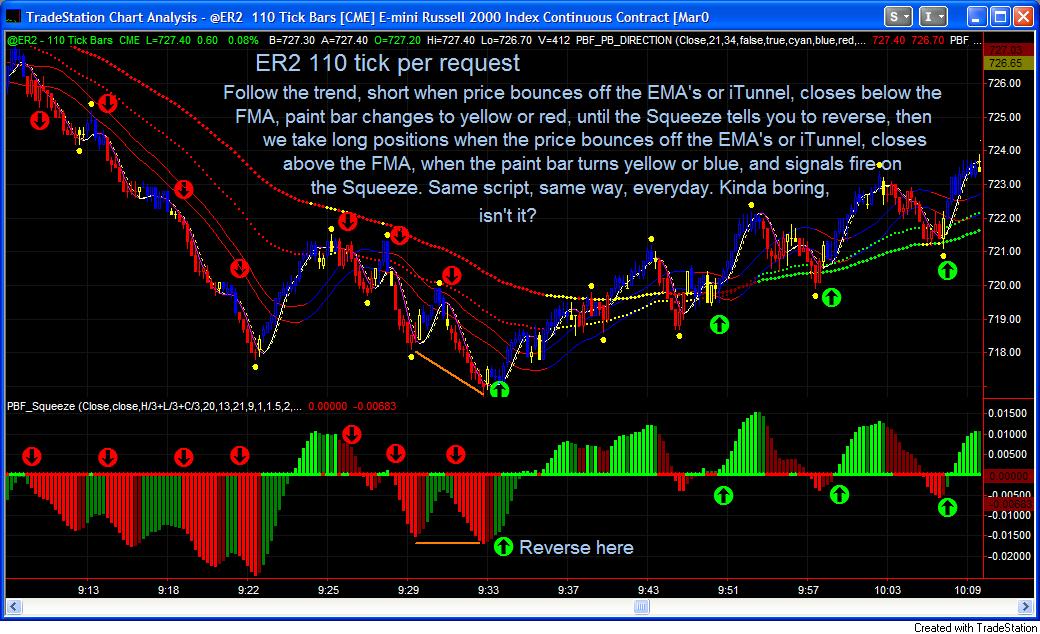
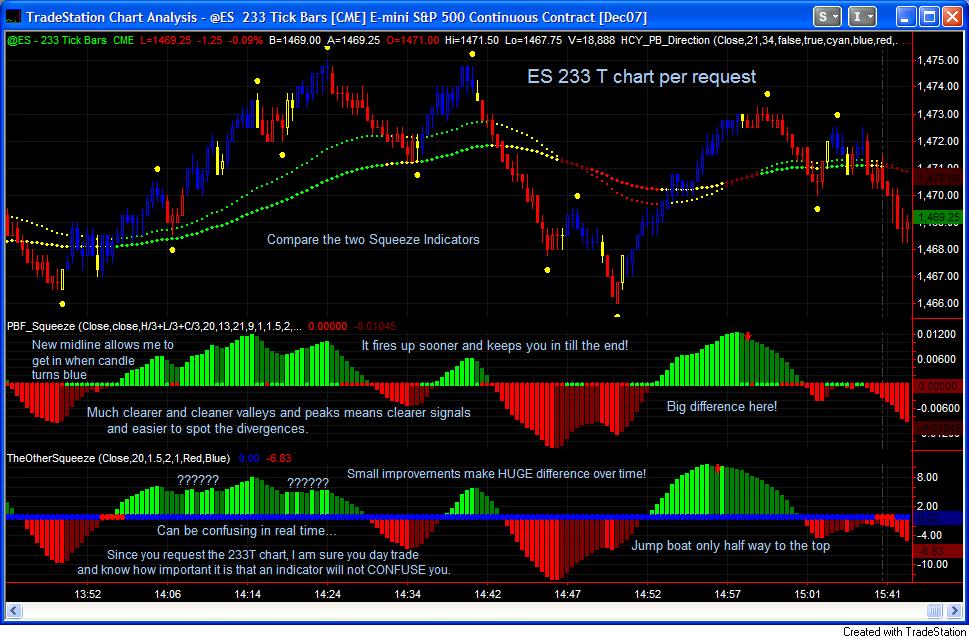
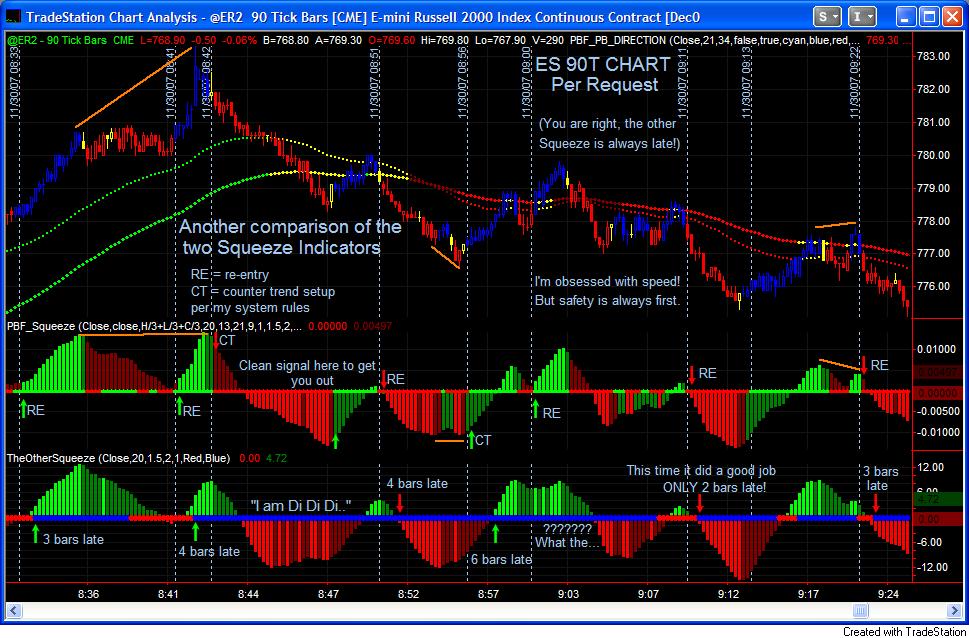
There are 3 levels in taking the signal. “The other Squeeze” has one: enter a position when the Squeeze “fires”. That’s our level 1 signal, and we only take it as a re-entry signal. Not only “the other Squeeze” is always late like a Gemini, level 2 and level 3 setups will already get us in a position before the Squeeze fires. By the nature of the indicator, you can not do this with “the other Squeeze” as it uses the momentum indicator. Waiting for the Squeeze to fire alone is not a safe entry signal, as you will often get false signals, especially in a trending market, you get the Squeeze firing up on the other direction, you think the market is reversing and take the counter trend trade, you will often get burned. The level 2 setup will allow you to avoid this situation and spot the true directional changes ahead of time. In the manual for the Squeeze indicator, you will learn the 3 setups. Level 2 is easy to spot, level 3 might need a little bit of practice, but the level 3 signal is often accompanied with “confluence of events”. If you own our indicator package, often when you get a signal to enter a position, within a bar you will have 4-6 other confirmations. When everything aligns, your chance of being right is very high. You can trade with free, lagging indicators, you can spend a lot of money buying expensive, useless indicators, and try your luck when placing every trade, or you can study the charts on this page, and decide whether it is worth investing a small amount of money for the best tools in the market today, and make consistent trades for the rest of your trading career. The system and indicators have helped me and many others, it will make a difference for you, too.
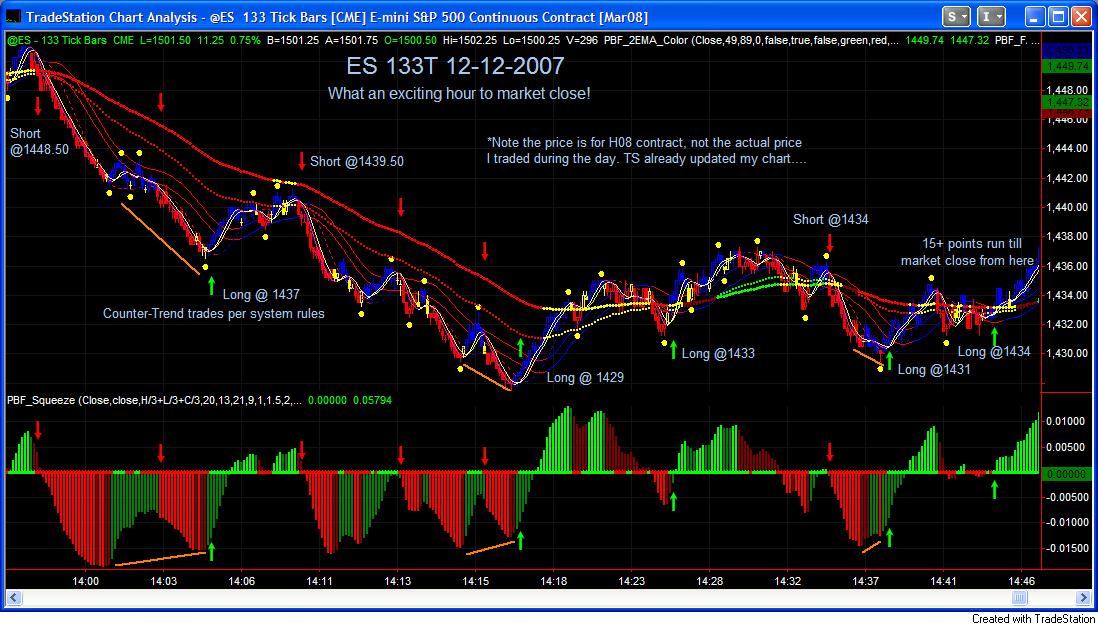
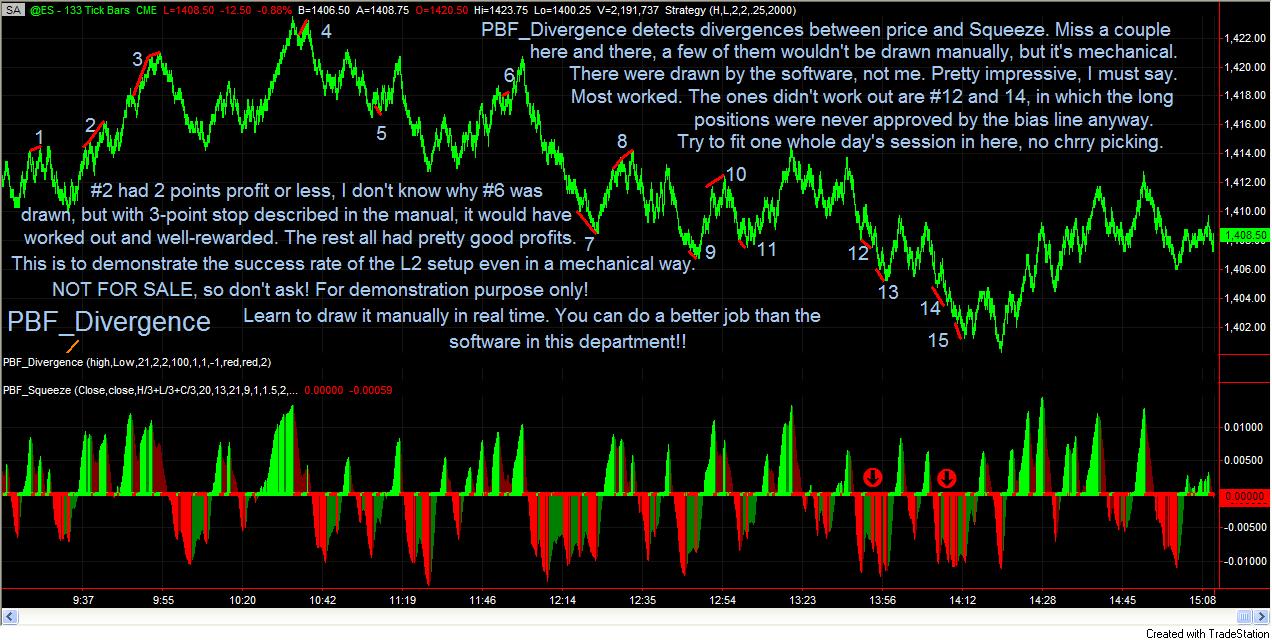
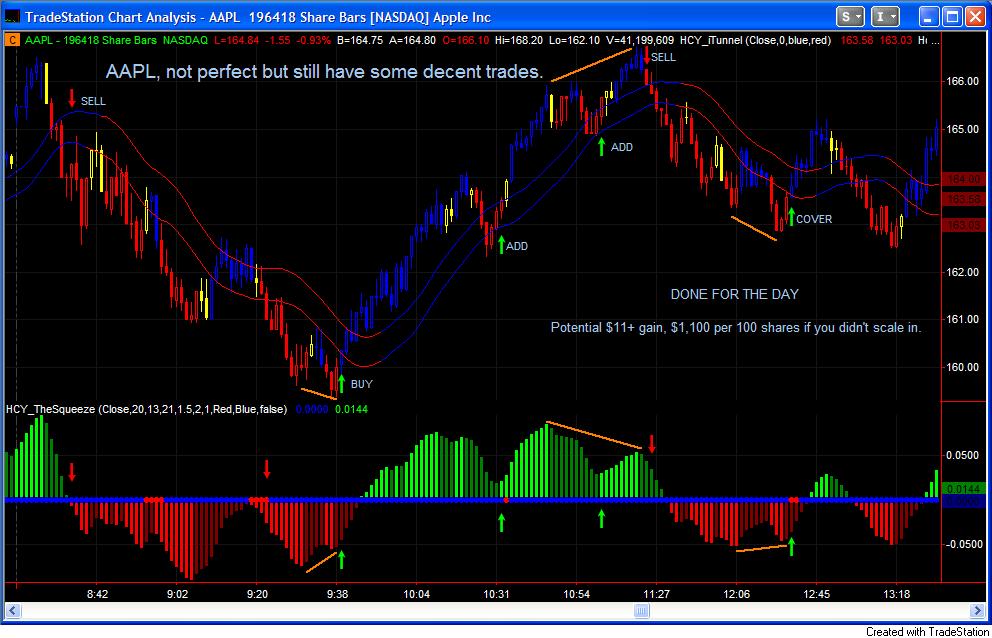
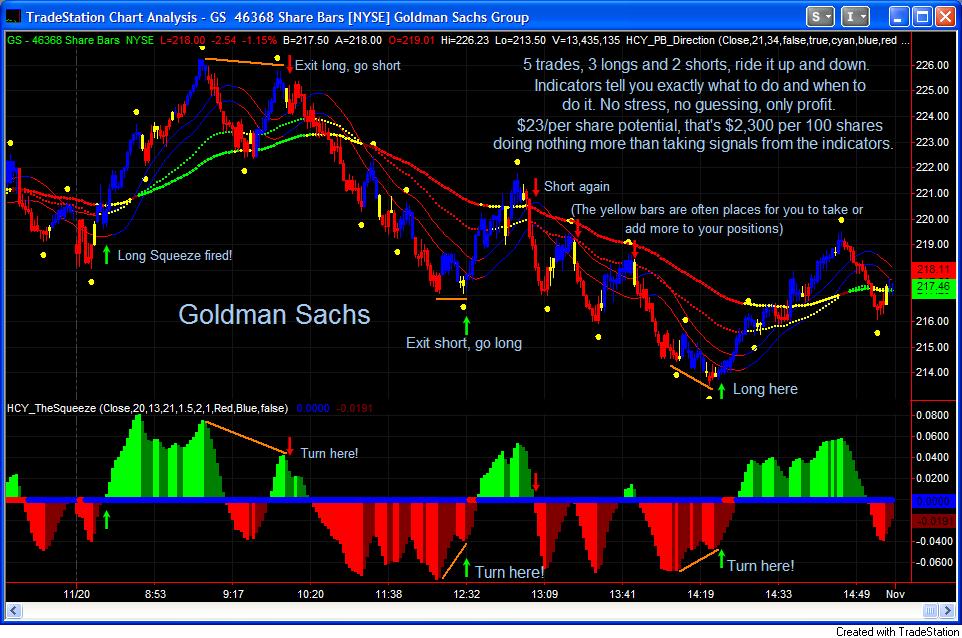
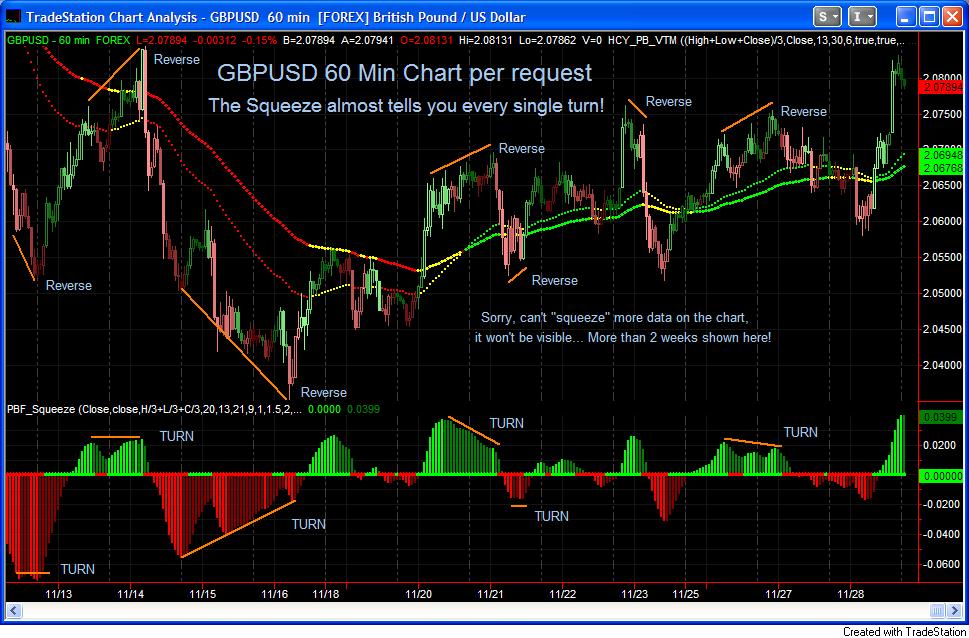
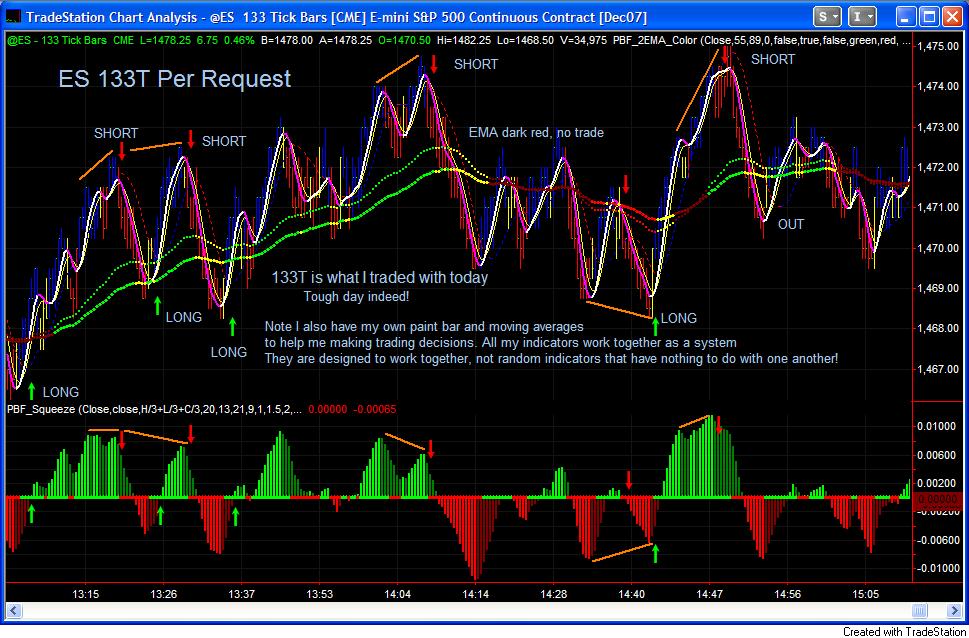
* All orange divergence lines, as well as the green/red arrows, throughout the entire website, were drawn and plotted manually for illustrative/explanatory purposes only, to show potential entry, re-entry points per system rules. They will not appear in real time as the “PBF_Divergence” indicator is not for sale. You will learn the system from the manual, and why or why not taking a setup when it occurs.
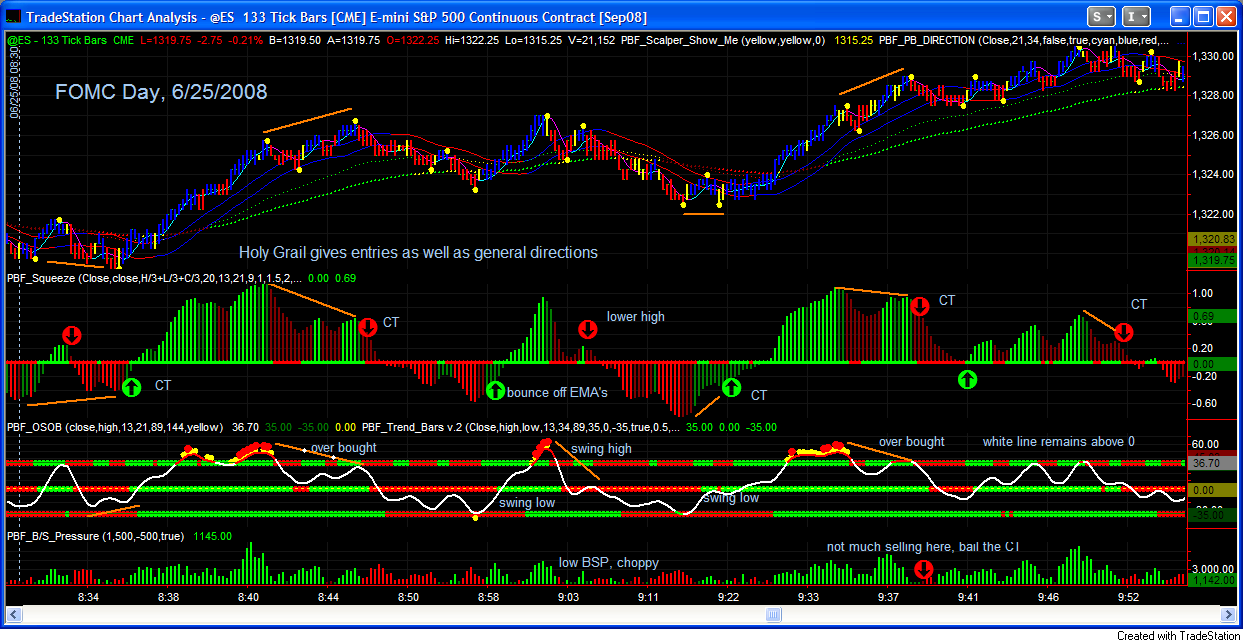
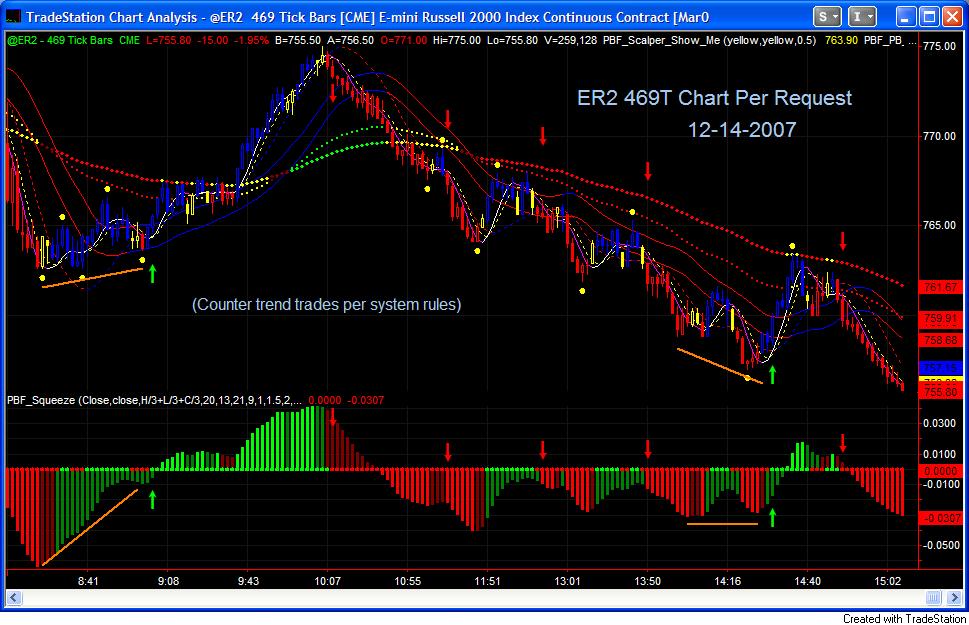
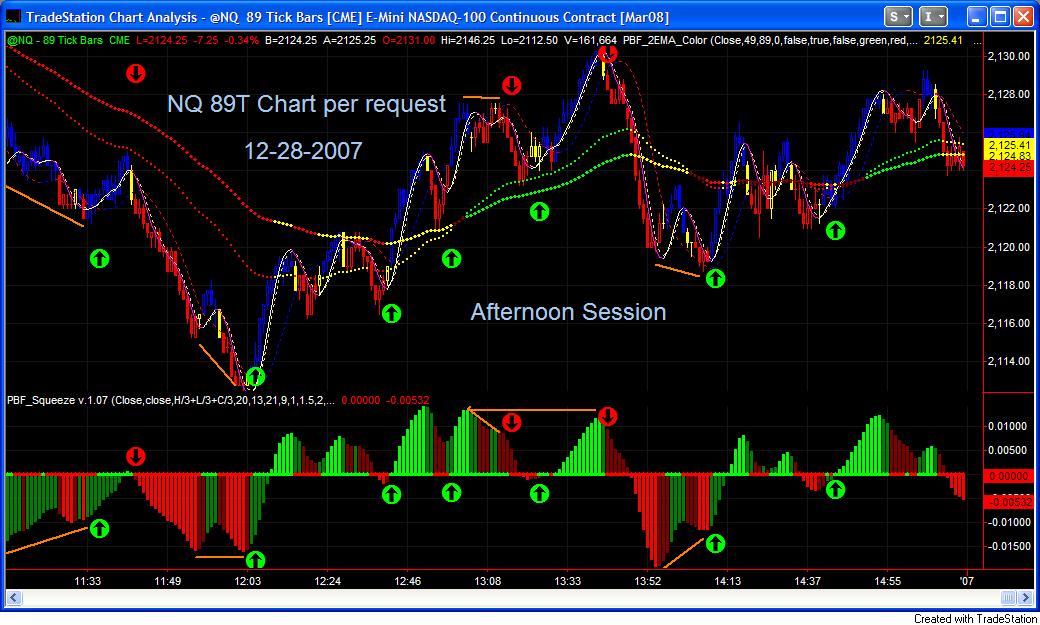
*On January 10th, someone challenged the Counter Trend setup in our system, having doubts about its sufficiency. We then spent an hour coding this new indicator, which identifies our counter trend setup in a MECHANICAL way. We plotted it on the chart, tried to fit the day’s session into this chart, the indicator identified 15 setups, merely compared the price action and the Histogram of the Squeeze (without taking the bias line into consideration). It missed a few beautiful setups here and there, and a few of the lines it drew, we will never draw them in real time. But it’s 100% mechanical. This kind of indicator probably will never work 100%, or it is due to our poor coding ability. The result? Out of the 15 setups throughout the day, 2 of them wouldn’t be executed because they were not approved by the bias of the Squeeze. One of them had 2-point profit or less, let’s call it breakeven. The other 12 were winners with at least 2-point profit potential, some had a lot more, depends on how patient you are and your ability to hold position through minor corrections. So we are not going to tell you how much you could have made with this more RISKY counter trend setup. What didn’t we have here? A LOSER. Luck, you think? Maybe. You be the judge. Note this is completely mechanical. One can do much better using a bit of discretionary skill.
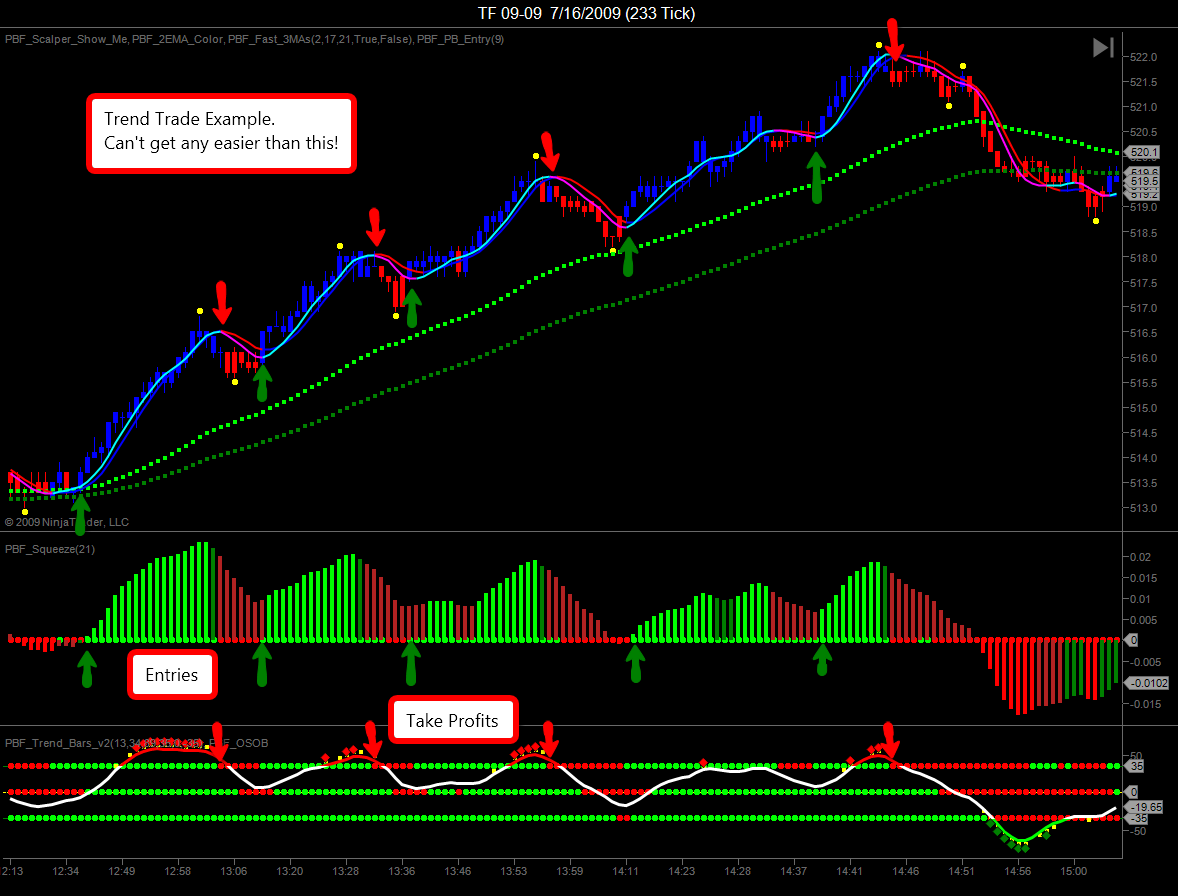
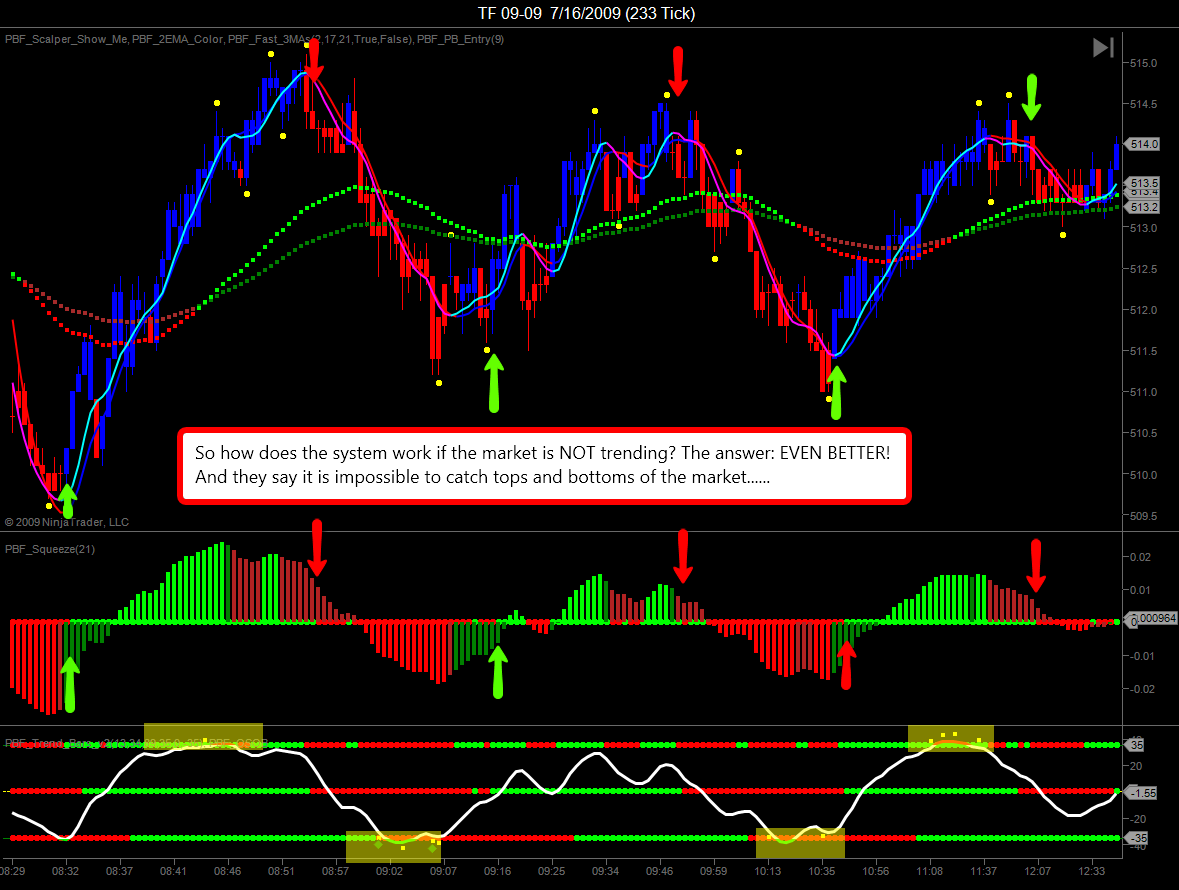
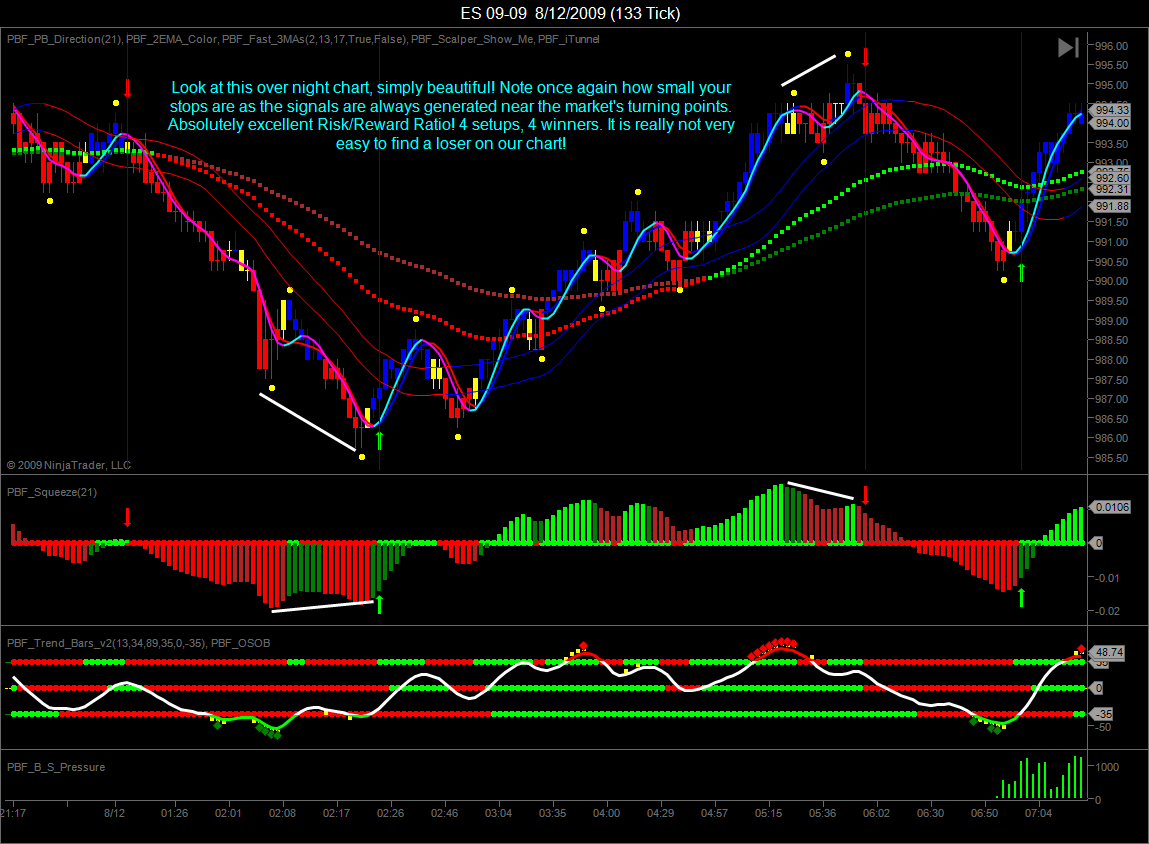
From here on, all orange divergence lines, as well as the green/red arrows, throughout the entire website, were drawn and plotted manually for illustrative/explanatory purposes only, to show the potential entry, re-entry points per system rules. They will not appear in real time as the “PBF_Divergence” indicator is not for sale. You will learn the system from the manual, and why or why not taking a setup when it occurs.
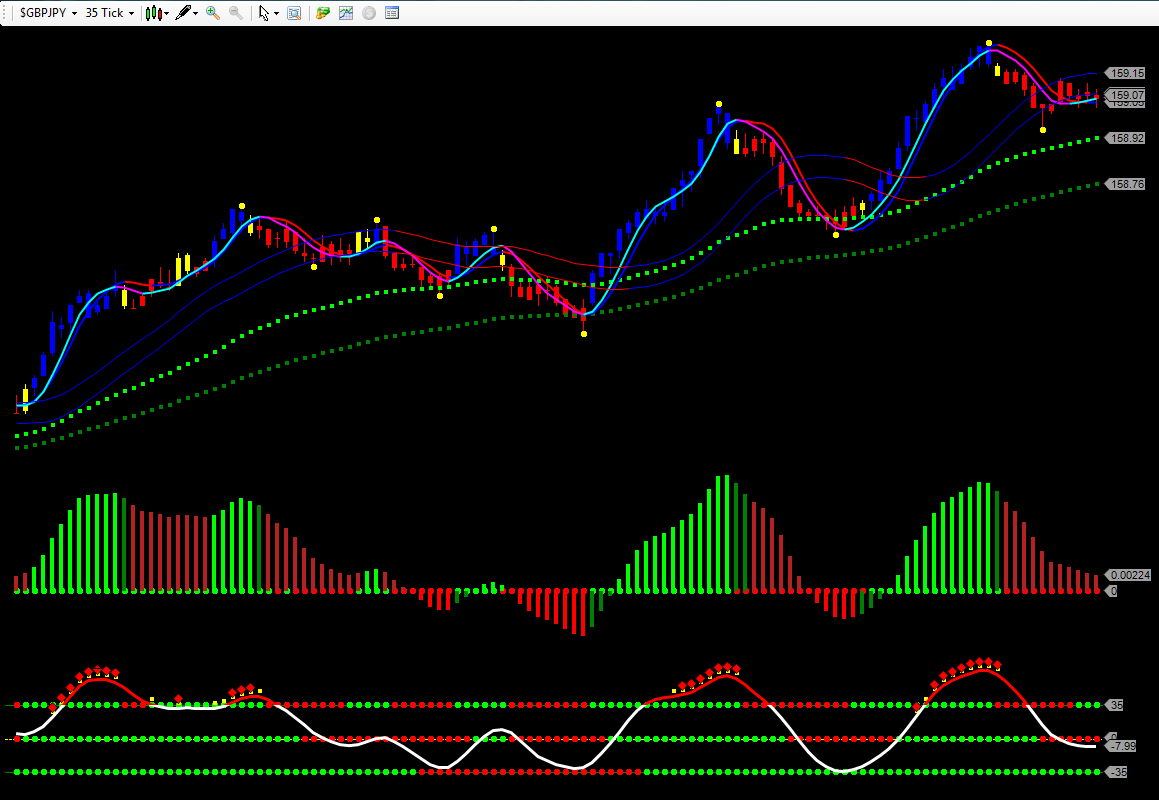
First, a screen shot of GBPJPY on NinjaTrader platform:
Study the charts and observe the setups from the indicators. How often do they fail?
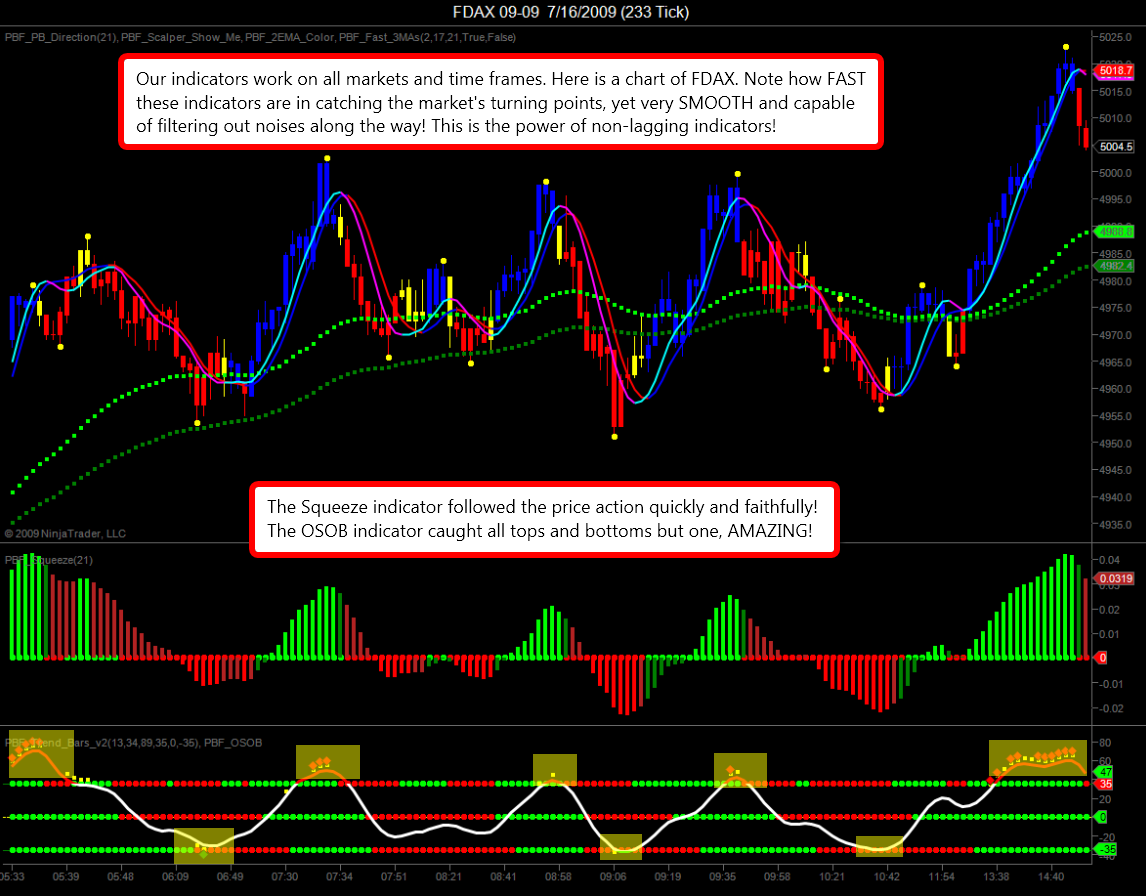
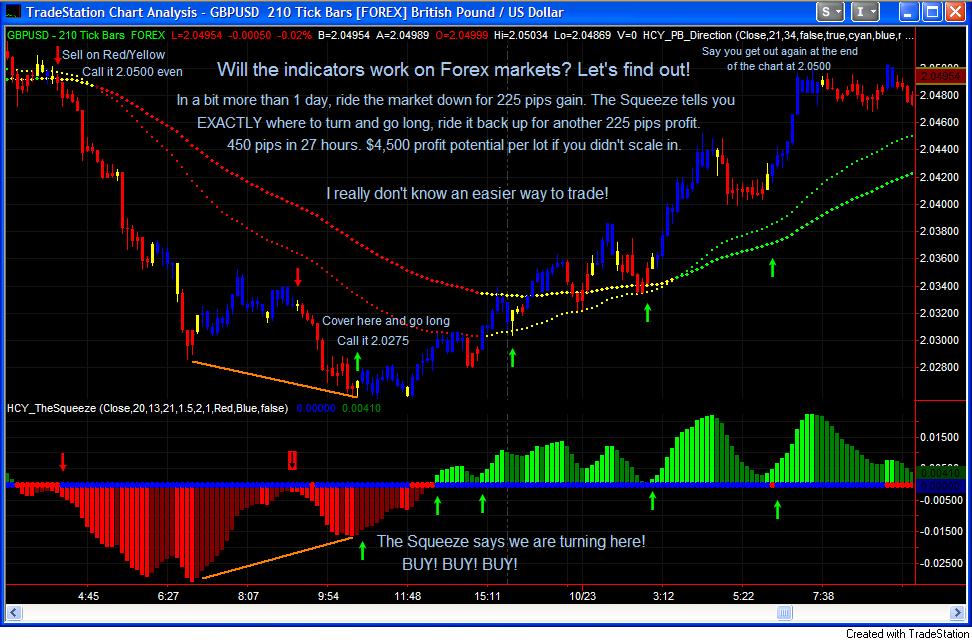
These indicators work equally well on all markets!
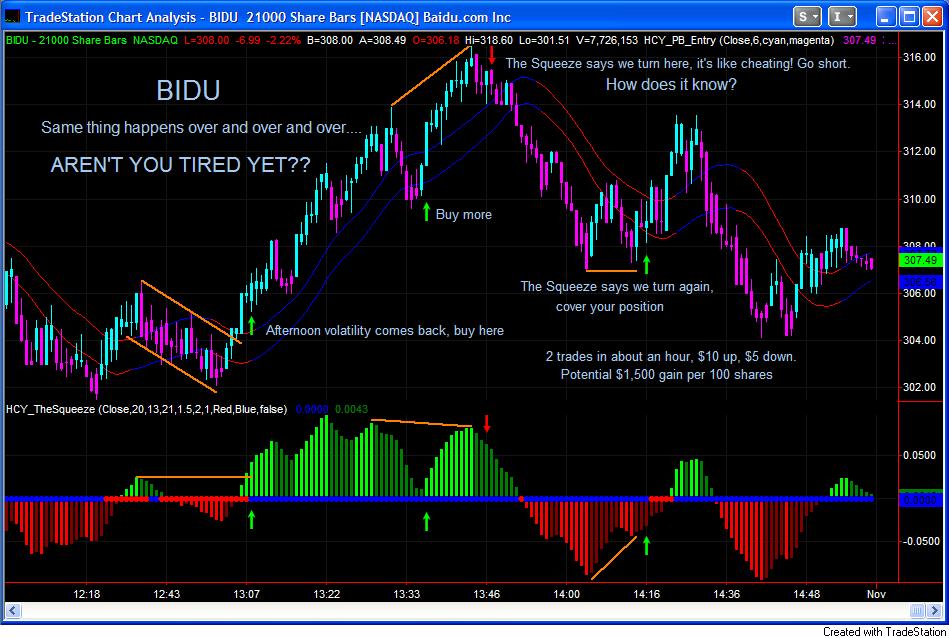
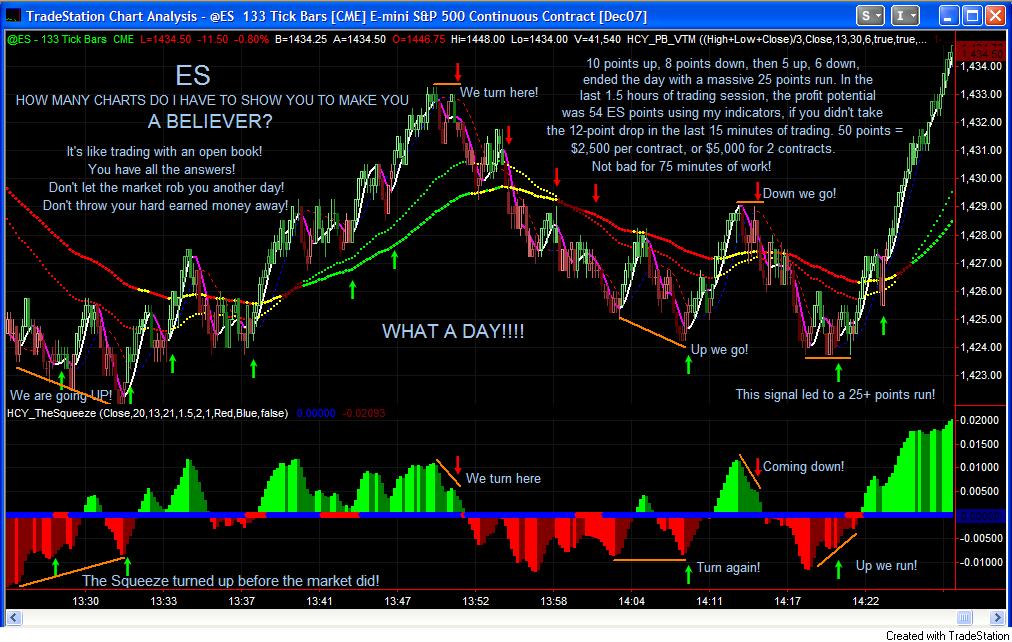
Same thing happens over and over and over….. Every day the market is open!
A day like this is what we live for!
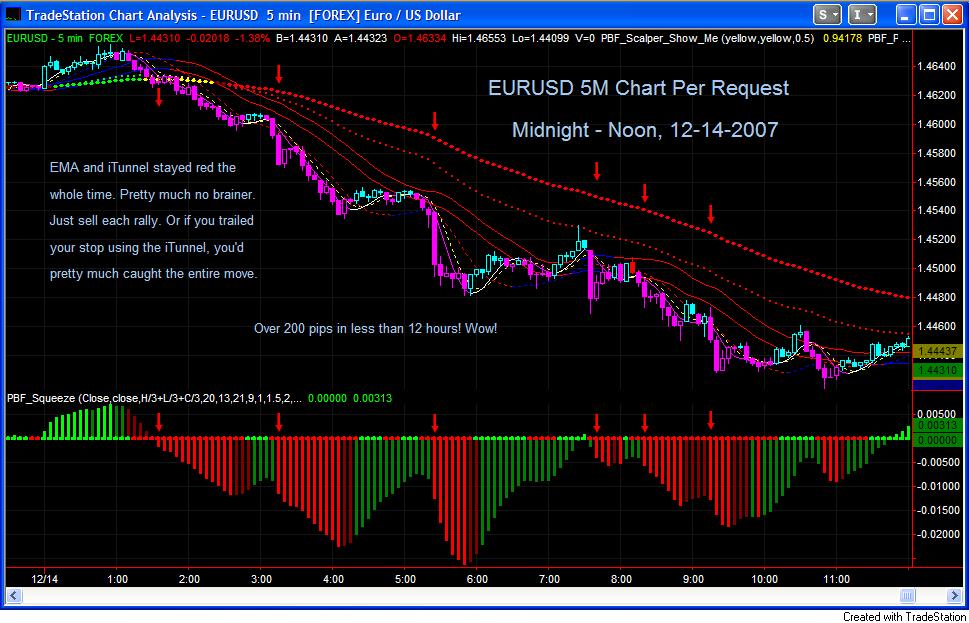
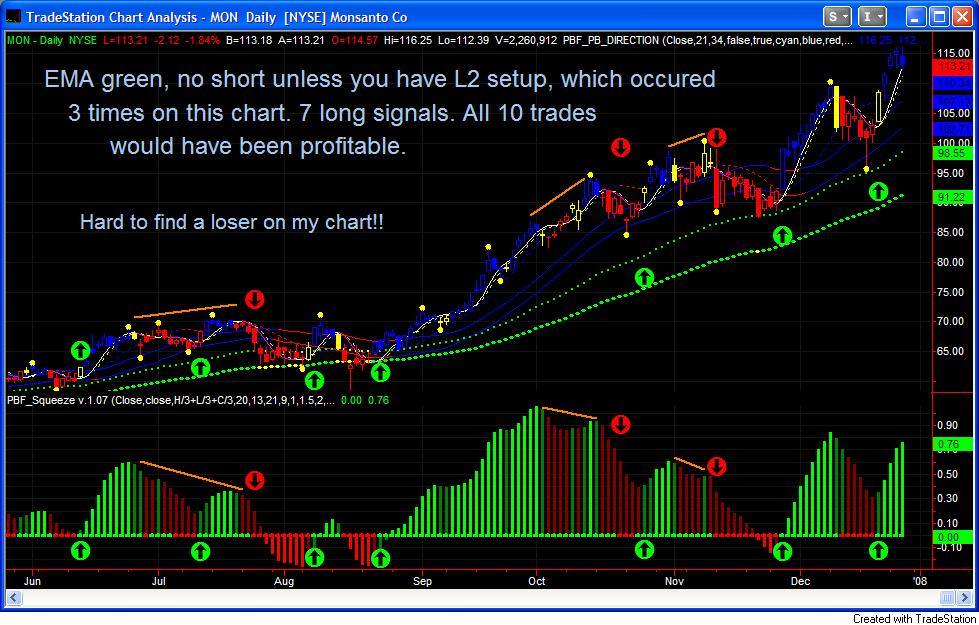
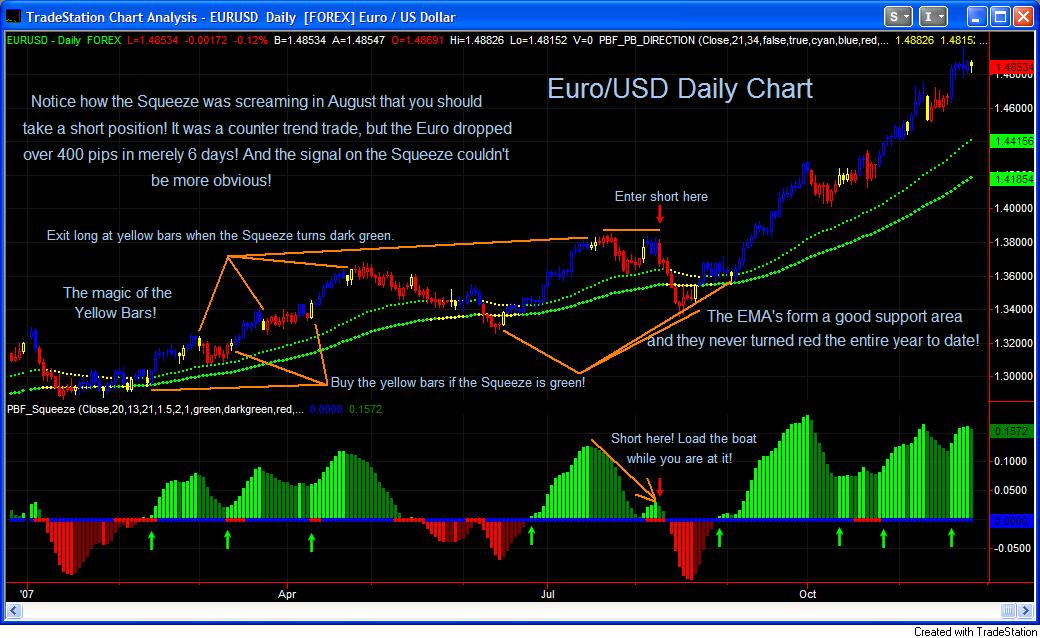
An Example of Forex Daily Chart. Where is it going from here?
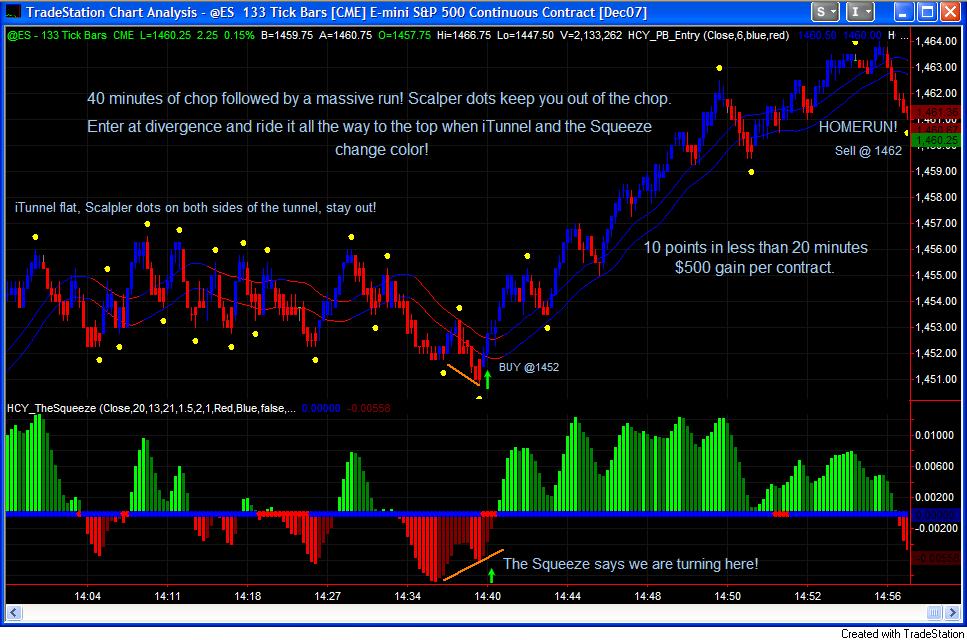
When to stay out is equally important as when to get in! The market will always reward your patience!
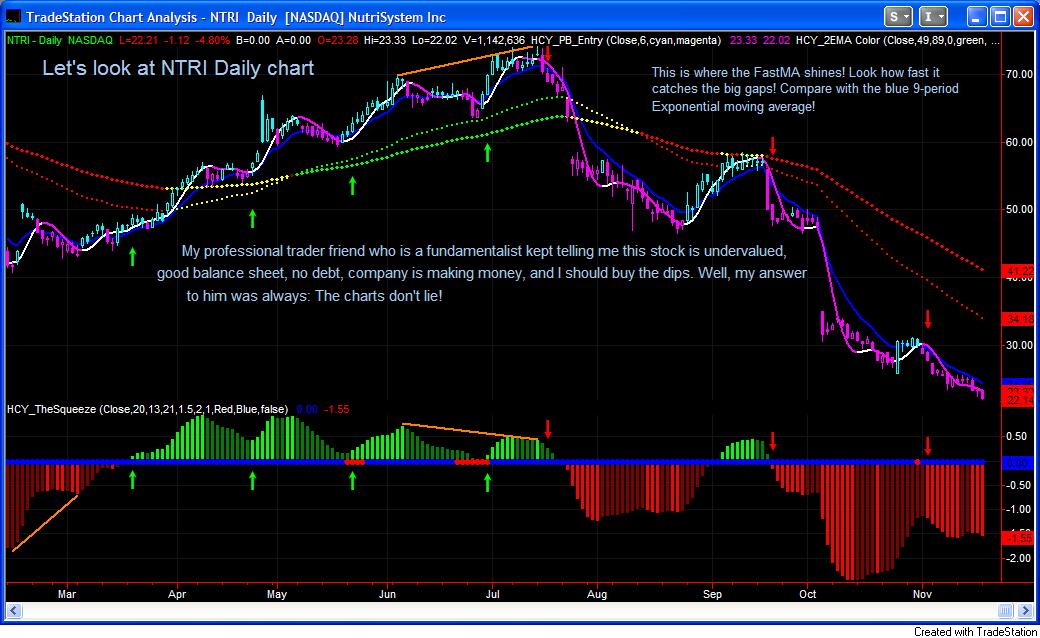
An example of a Daily chart with gaps all over! These indicators work well on all time frames!
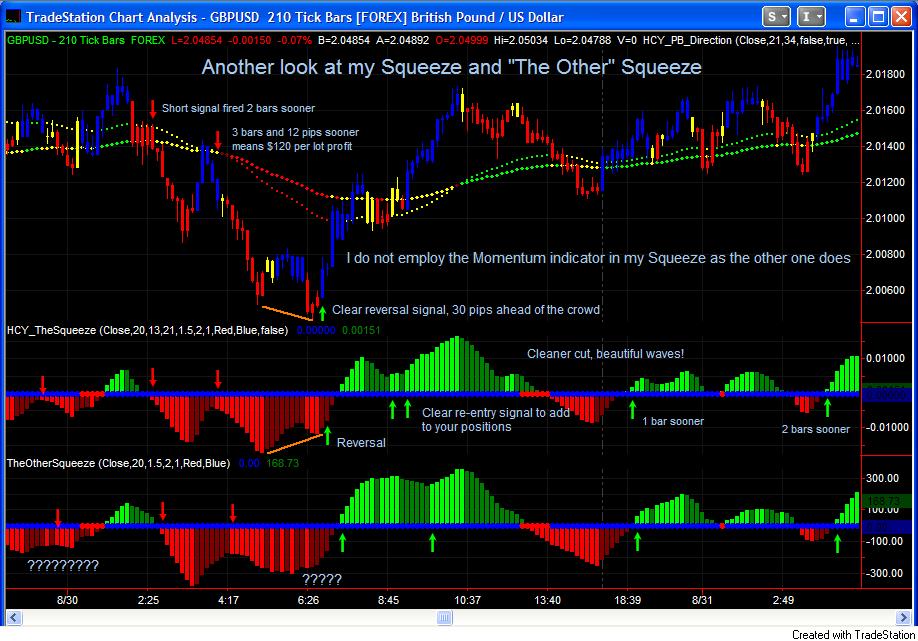
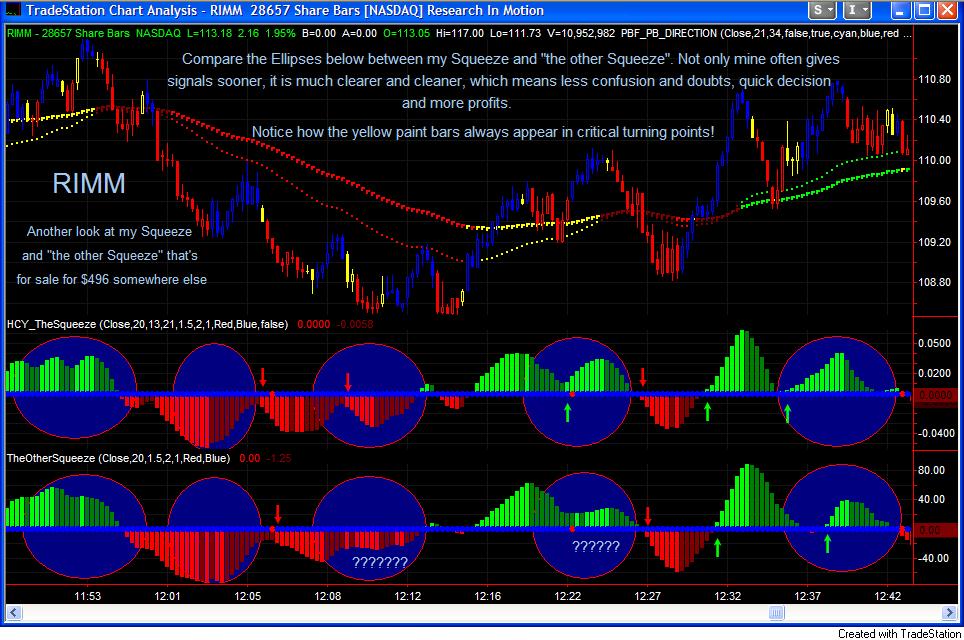
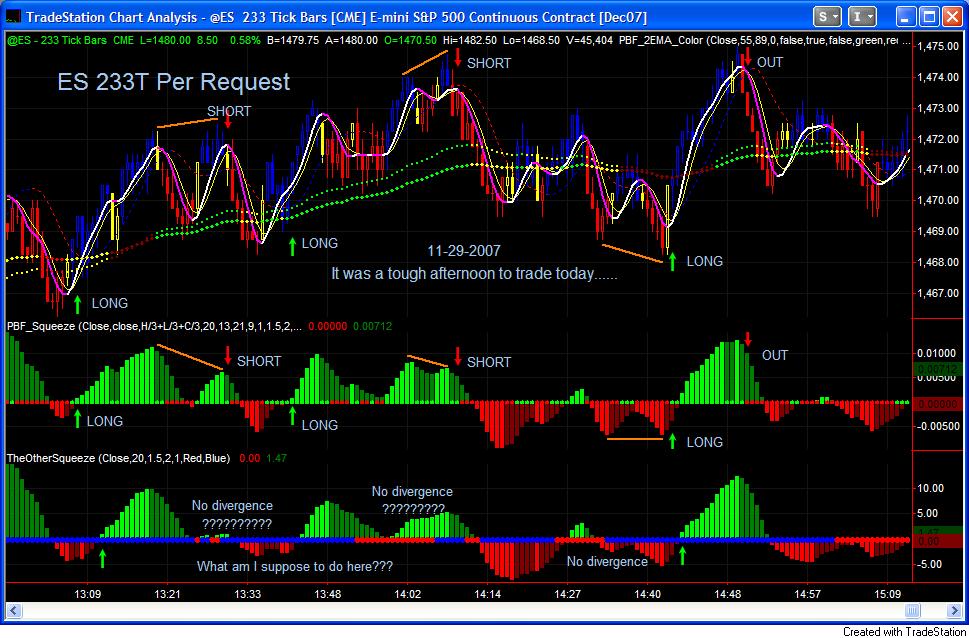
Compare my Squeeze with the well-known Squeeze!
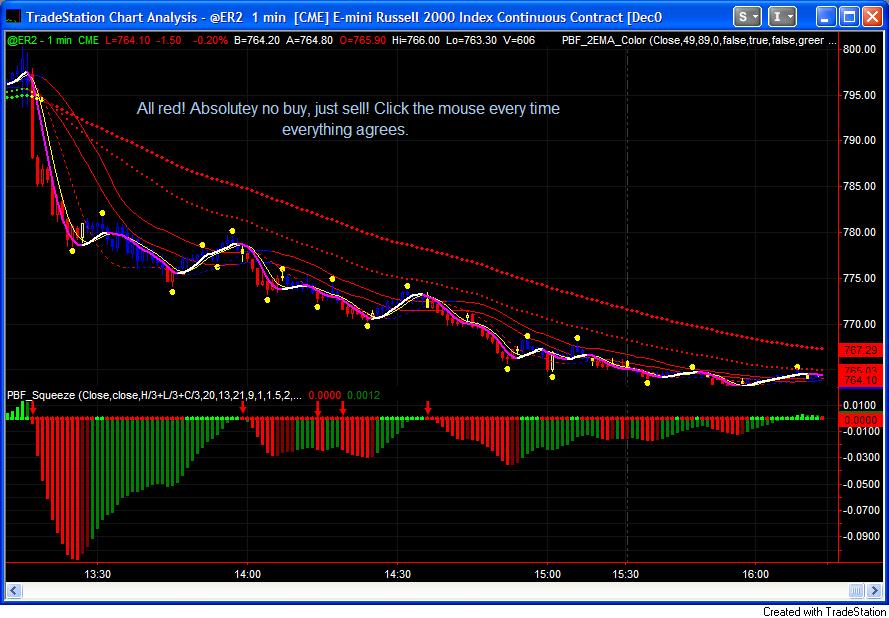
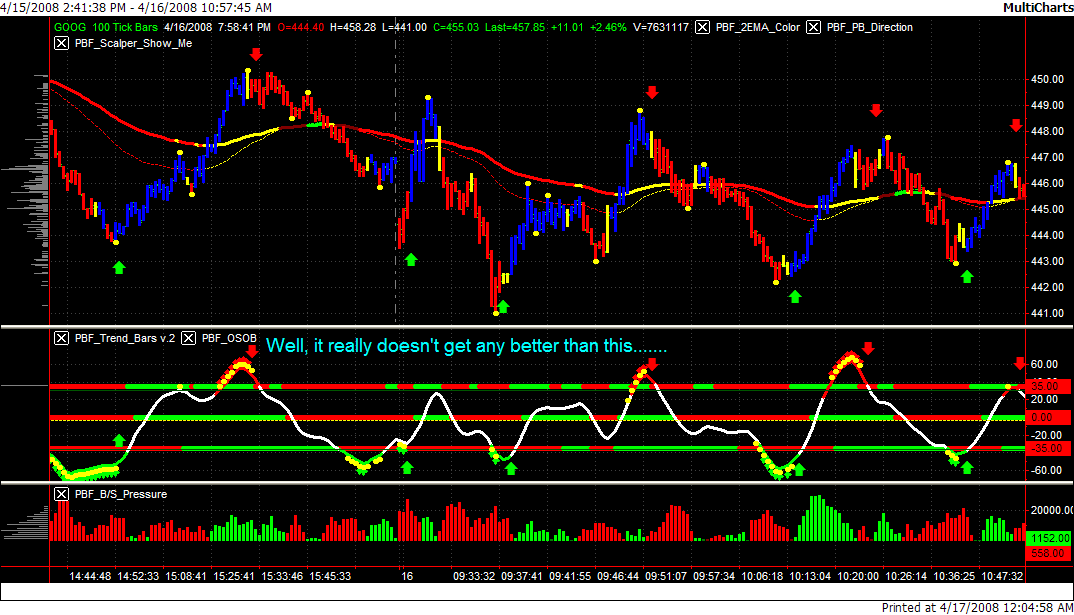
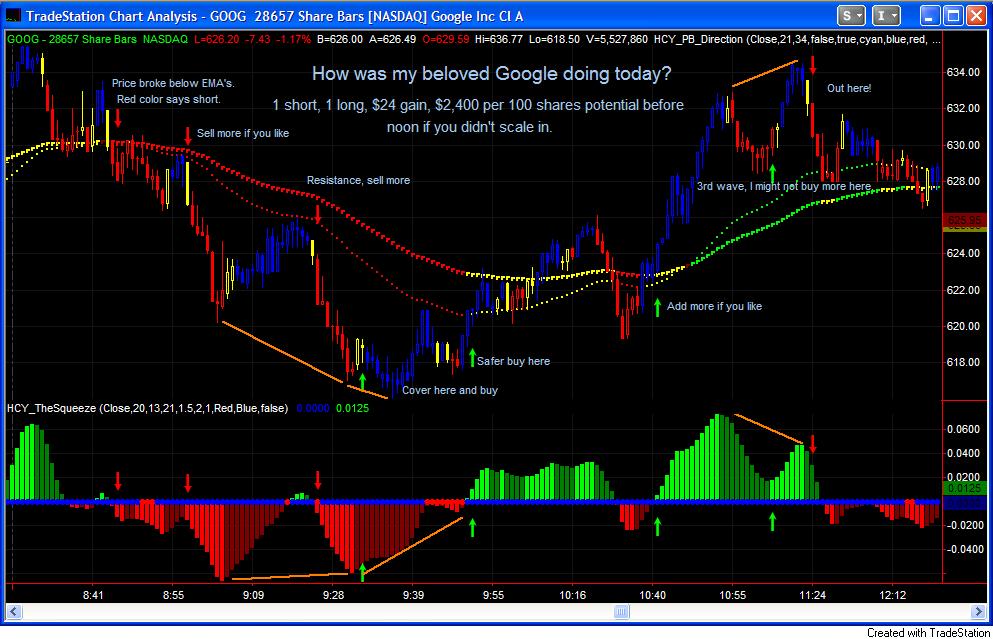
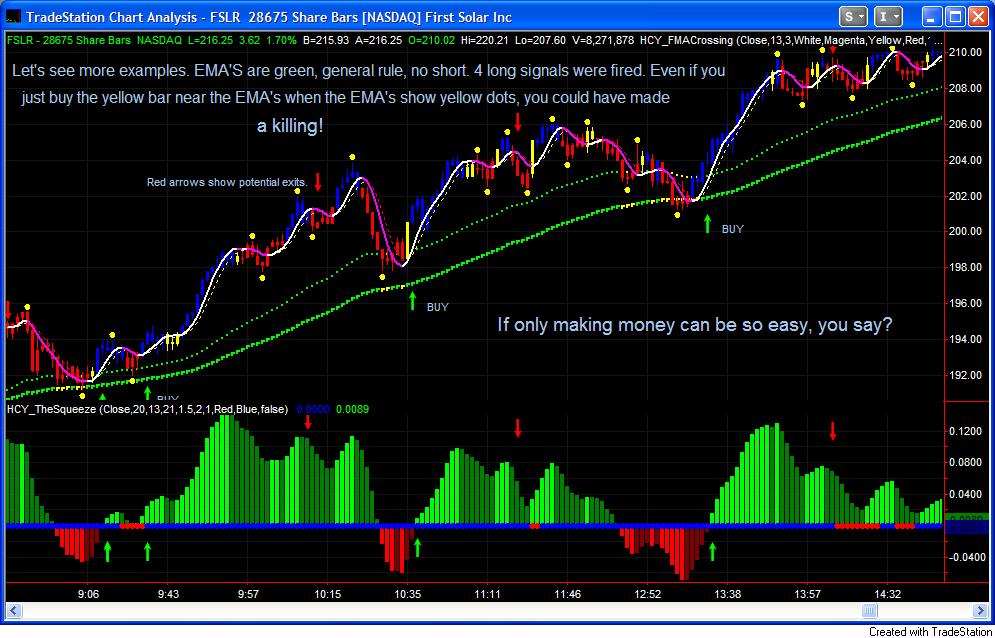
Sometimes trading really can be so easy! If you have the right tools!
Another look at the difference of the two Squeeze indicators!
The magic of the Yellow Bars!
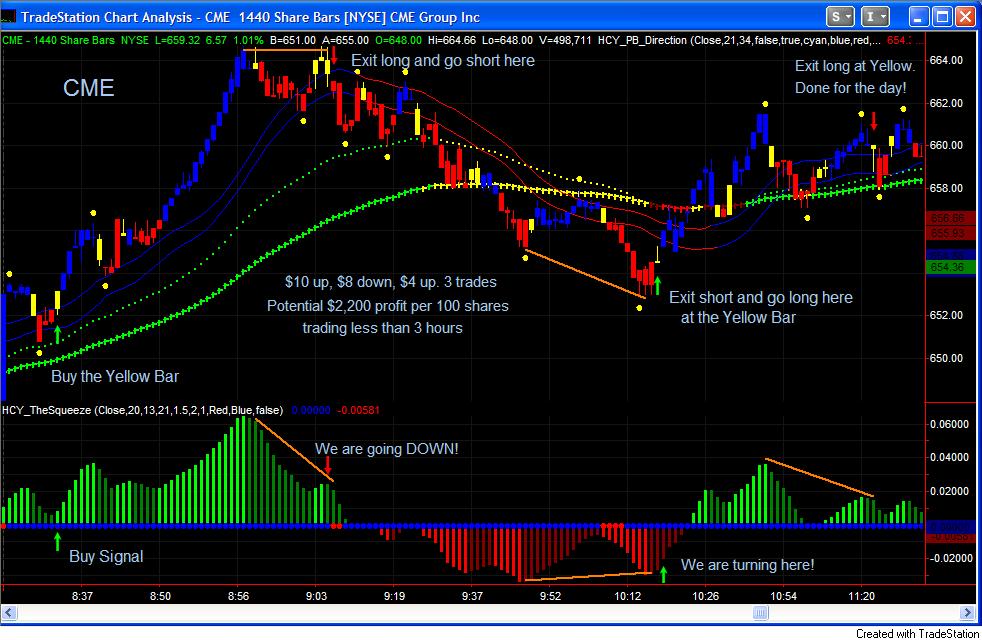
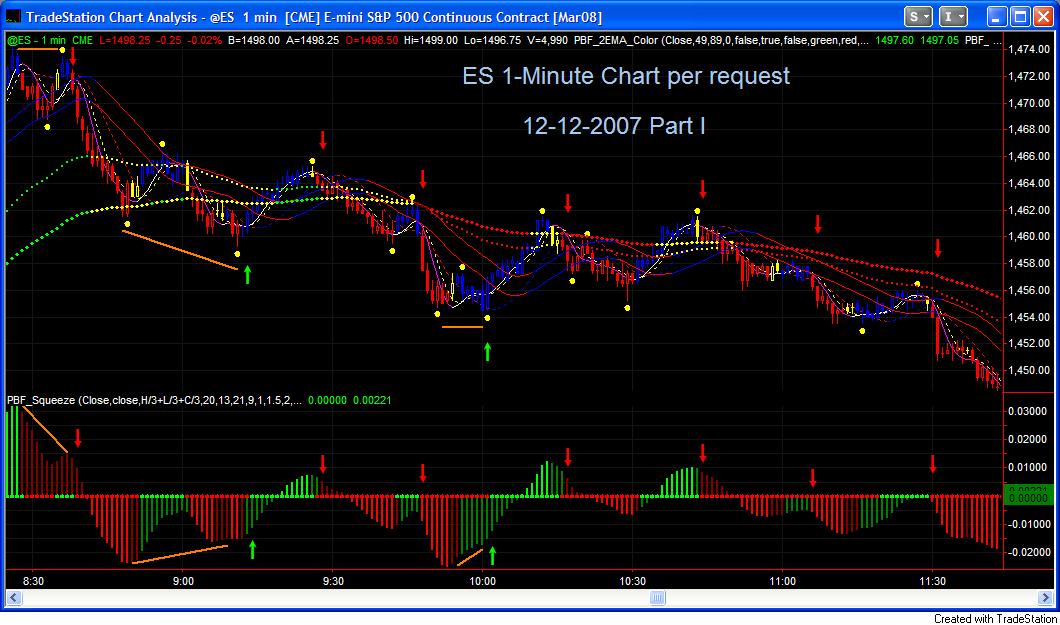
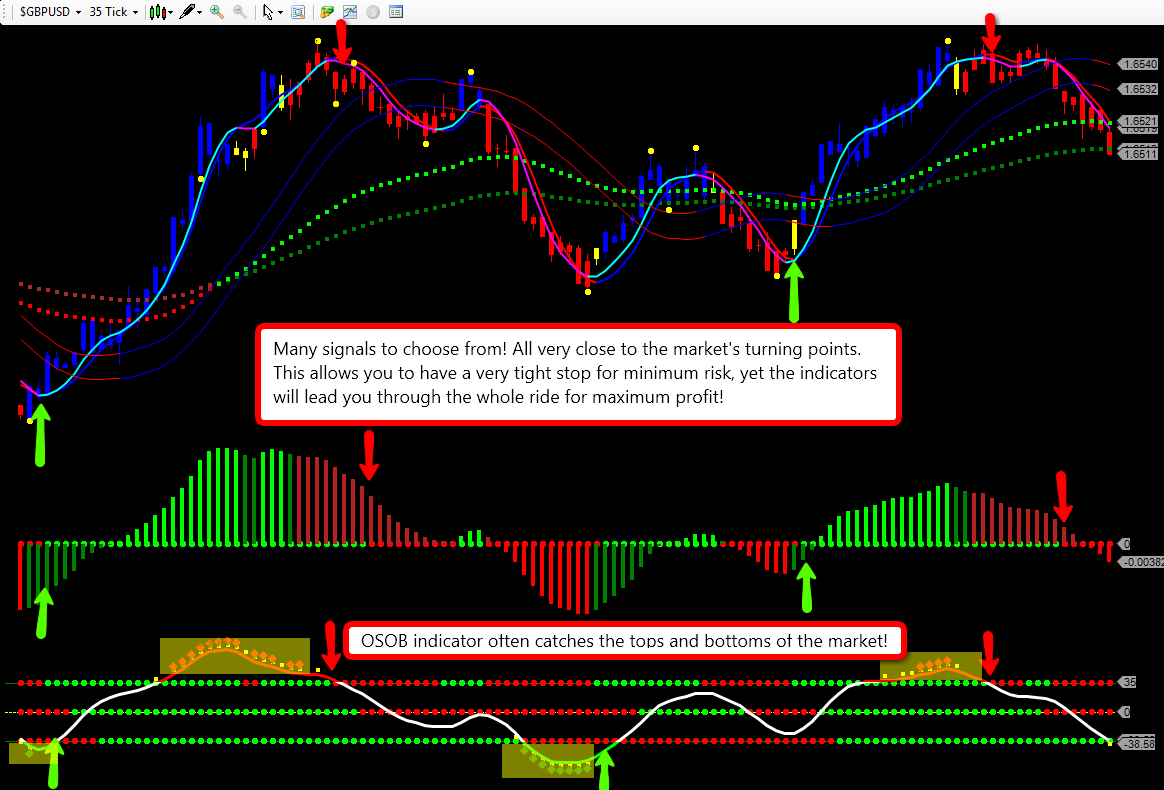
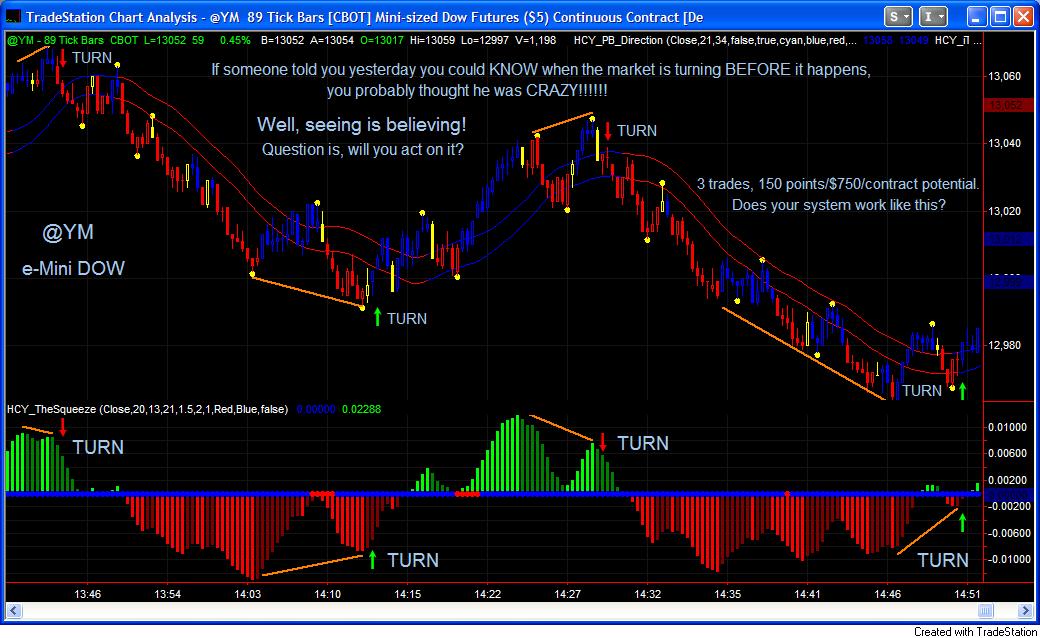
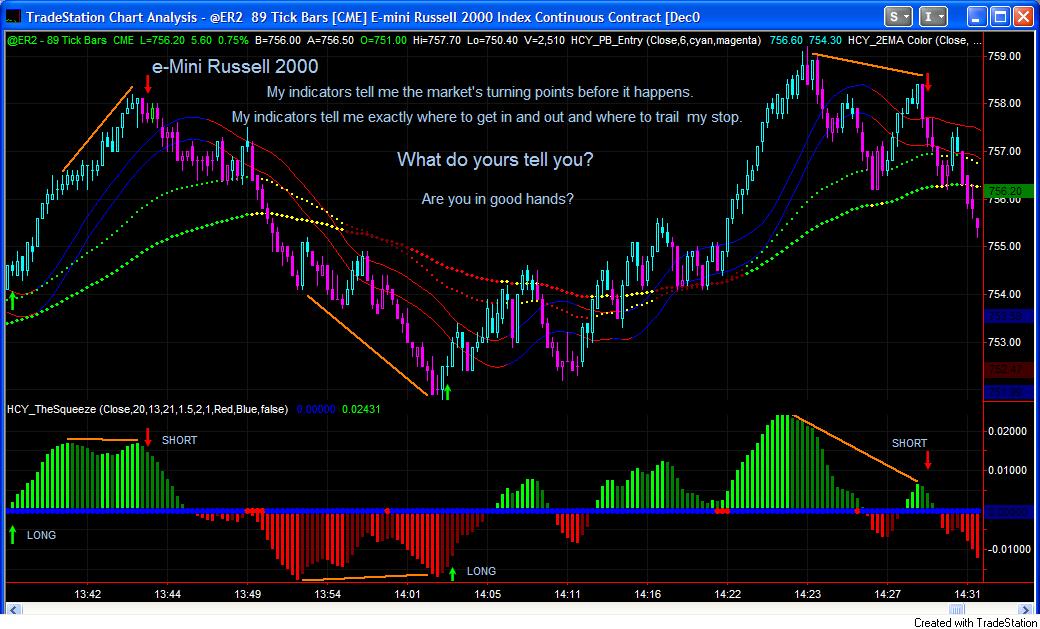
The Squeeze pinpoints the market turning points!
The indicators allow you to take counter-trend trades as well!
If only everyday is like this!