Show Me Dots ($167.00, and get the Scalper Dots, valued at $498.00 available from another company, for FREE!)
Like we discussed on the home page, when coding an indicator, if you try to make it too sensitive, you may get a few false signals. If you make them less sensitive, you may get in too late. My Buy/Sell Show Me dots does a pretty good job of getting you in a position at the right time, while not generate too many false signals. Of course, you will get many, many dots when the market is choppy, moving sideways, and going nowhere. Learn when NOT to take a signal is, sometimes, more important than when to take one. The default setting is 9 as shown in the picture. You may twist the number a little! The interesting thing is, even if you change the number to 21, the signals might come up just one bar behind the number 9 setting, yet you will be able to screen out some false signals. It depends on your trading style. Personally I like to get in as close to the turn as possible, and manage the trade myself, that’s why the default is 9. Once the dots are plotted, they will stay there and never disappear.
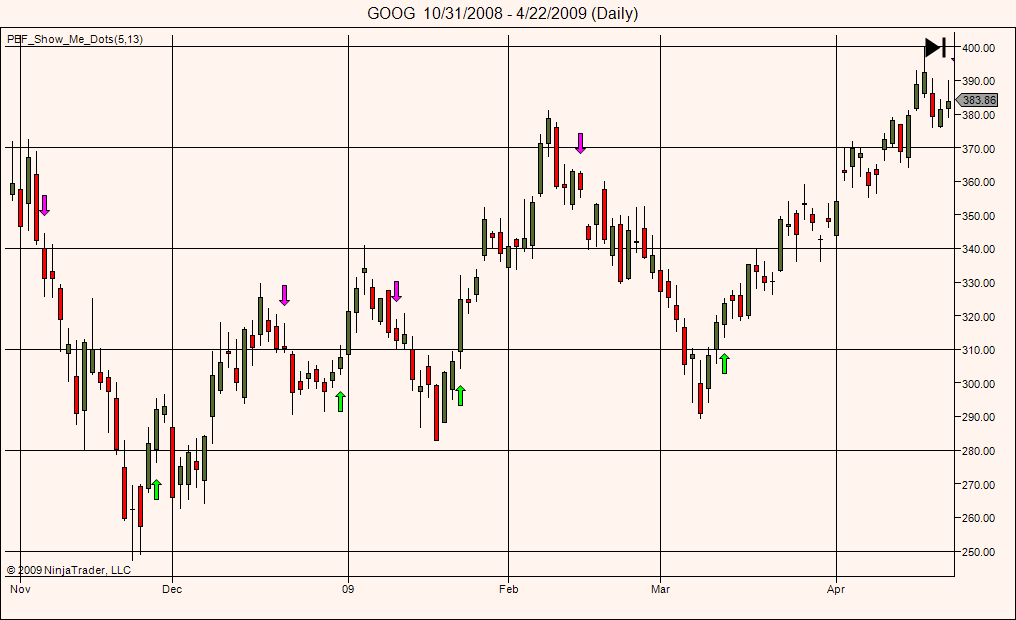
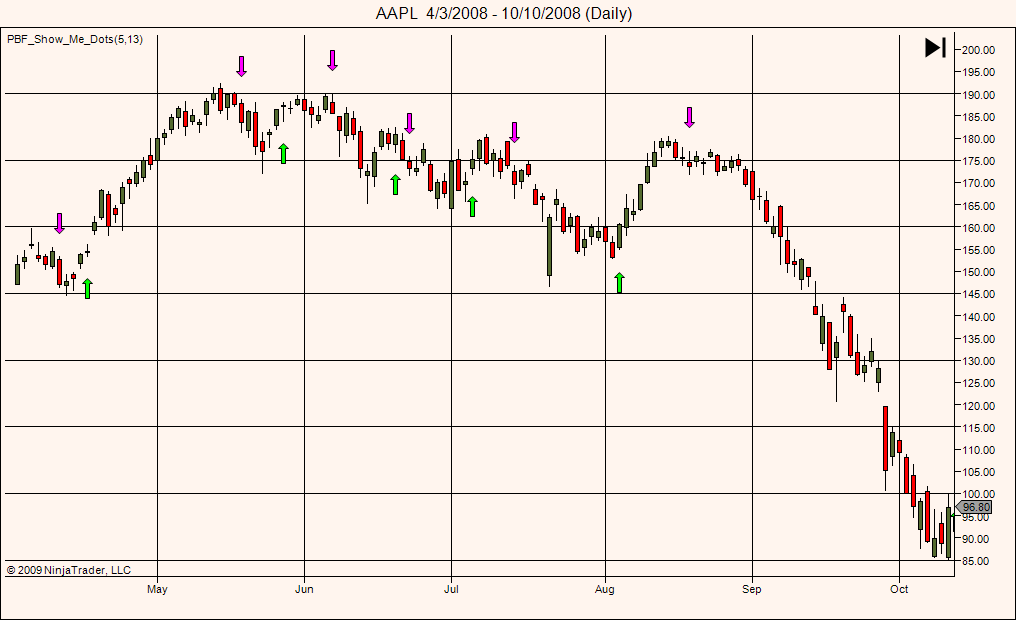
Below are a couple of screen shots of PBF_Show_Me Dots on NinjaTrader Platform. Because NinjaTrader allows us to draw arrows, instead of dots, we have coded this indicator in the form of arrows.
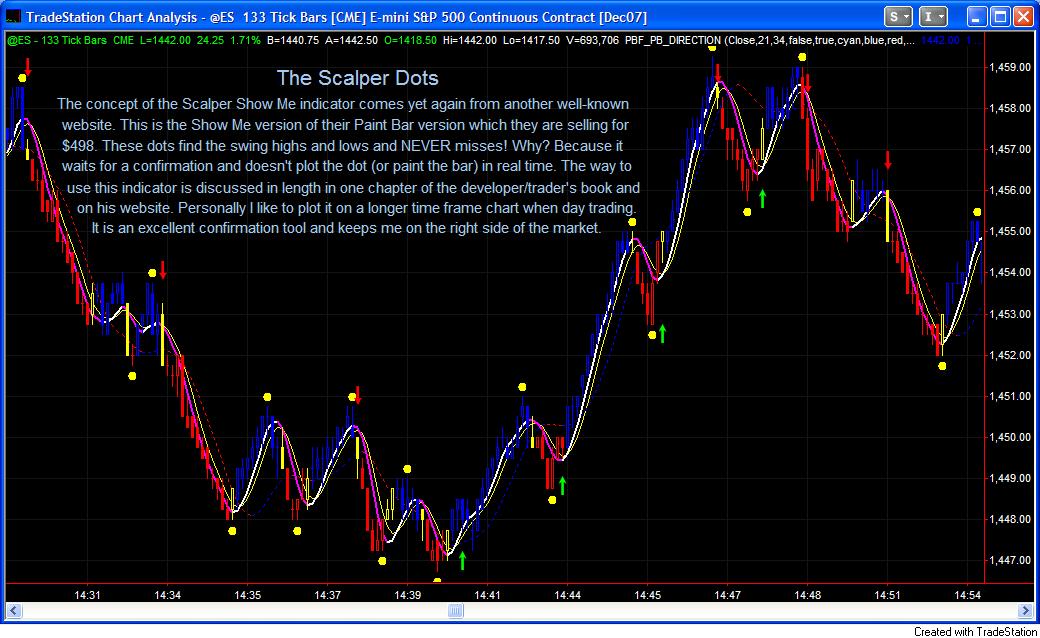
The Scalper Dots (valued at $498.00 from another website, yours FREE with the purchase of the Show Me Dots above)
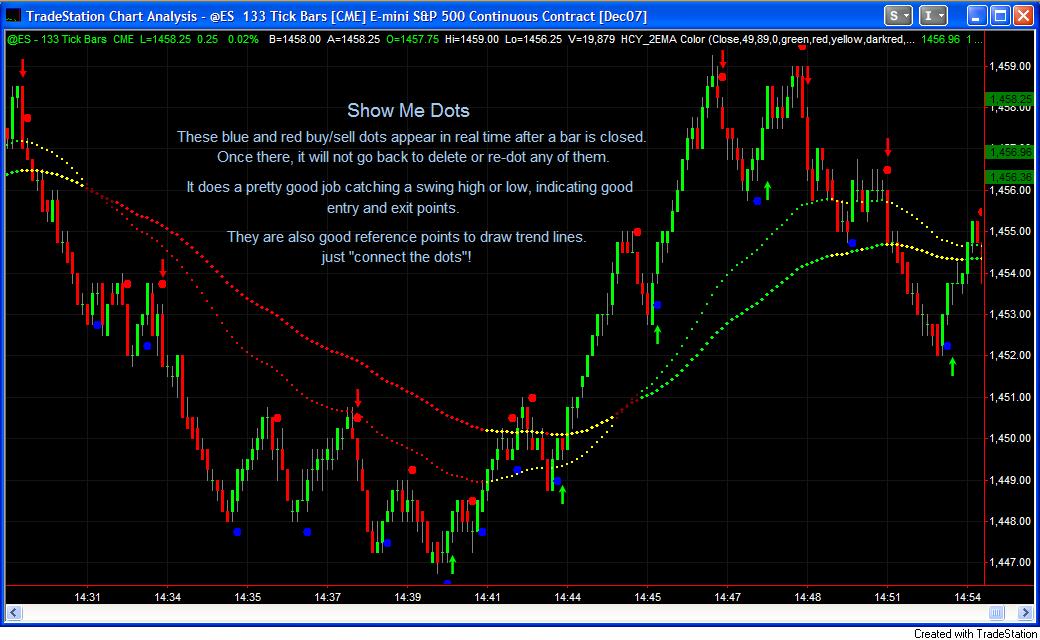
As described on the chart, this Scalper Dots do a great job finding swing highs and lows and with accuracy. The only way to achieve this is to wait for a confirmation and then plot the dot, usually within 2-4 bars, depending on the price action. A certain criteria has to be met first for the dot to plot and confirm that it is indeed a swing high or low. Please visit the Trial/Video page to view a couple of video clips on how it works in real time. You might be thinking how good is that then if it doesn’t give you the signals in real time. According to the professional trader who first came up with the idea of this indicator, he certainly has many ways to use it. Personally, I find it extremely useful in helping me identifying the market structure and price action in real time trading. I can see the highs and lows of each swing at a glance. I also use it to draw trend lines, just “connect the dots”. When I connect two dots and extend it to the right, the third dot often lands on the line. If you allow the market to breathe, trade the price action and follow the trend, they are also good places to trail your stops. I also use it as a confirmation signal. If you compare with the chart below with the chart above, you will see that the blue and red buy/sell signals often appears (in real time) 1 or 2 bars behind the Scalper Dots. In other words, if I take a position according to the Show Me Dots above, I expect the Scalper Dots to be painted within a bar or two. It is also very useful when you swing trade, buy and hold stocks or currencies, or day trade Forex, as currency markets don’t move as fast as e-Mini or day trading stocks, sometimes wait for the confirmation, you might get an even better price!
Below is a screen shot of PBF_Scalper_Dots on NinjaTrader Platform.
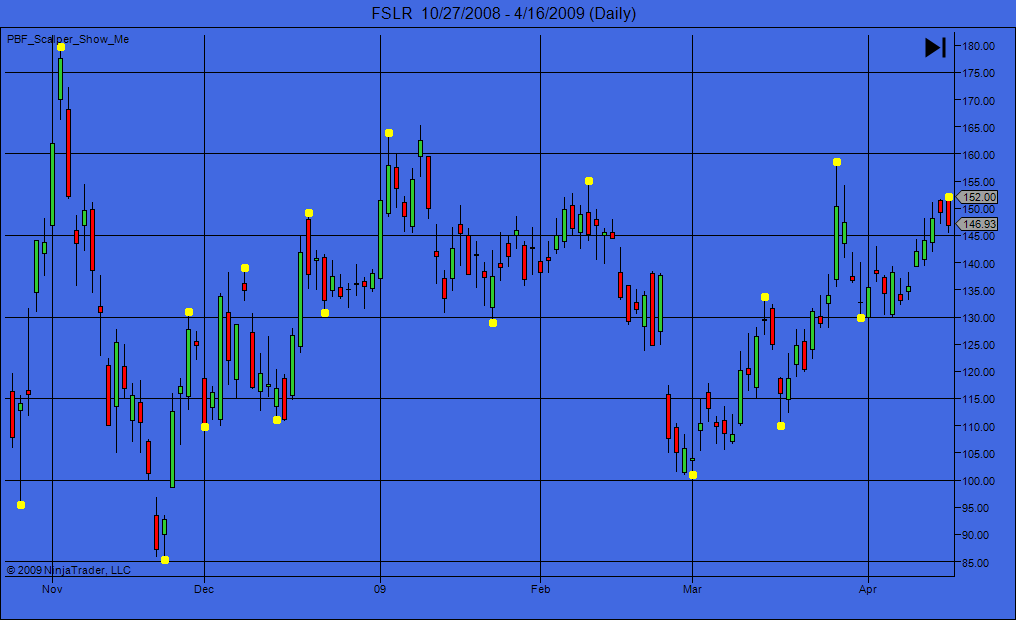
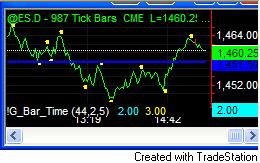
Below is my “anchor chart” when day trading e-Mini S&P 500. I plot nothing but the pivot lines, yesterday’s OHLC, and the Scalper Dots. If I get a Scalper buy and before I see a Scalper sell, I will pay more attention to the long side and vice versa.